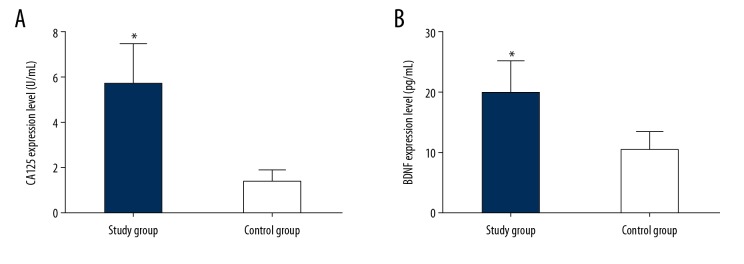
Figure 1.
(A, B) Comparison of serum CA125 and BDNF levels between the study group and the control group. (A) Comparison of serum CA125 levels between the control group and the study group; (B) Results comparing serum BDNF levels in the control group and the study group. (* P<0.001 compared with the control group).

