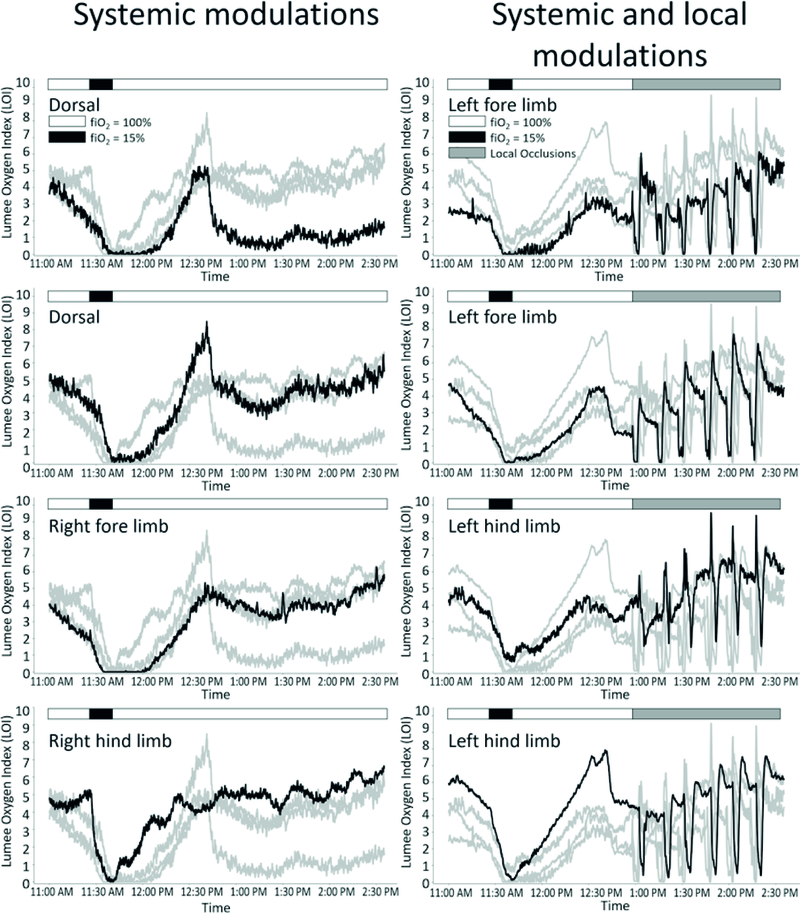
Fig. 2.
Individual microsensor traces from eight separate sensors during systemic and local oxygen challenges 6 months post-injection. Graphs in the left column were tested with systemic oxygen challenges. Graphs in the right column were tested with systemic and local oxygen challenges. Anatomical location of black sensor trace is indicated on each graph. Grey traces are the other sensors with the same modulation types (systemic only or systemic and local oxygen challenges). Displayed are the LOI measurements versus time. Microsensors detected tissue oxygen reductions in response to systemic and local hypoxic events

