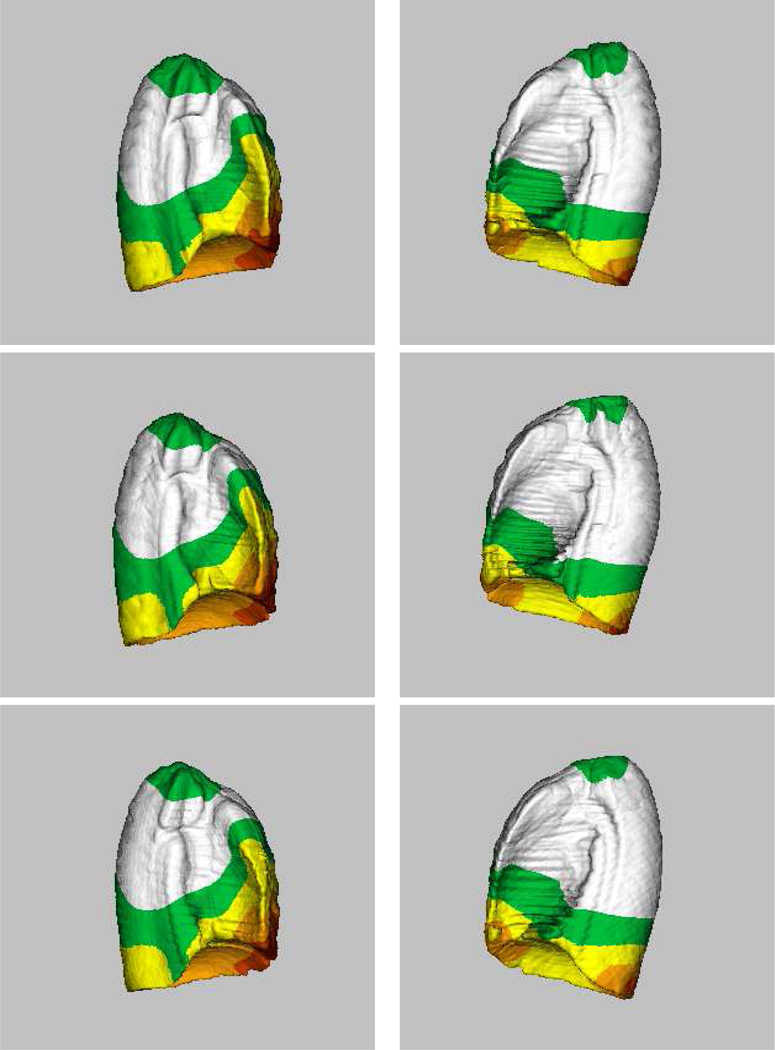
Figure 8:

Computed lung atlases (averages + shape variations) from twenty subjects, using three different subjects as the template. (Top row) Subject 9 as the template. (Middle row) Subject 19 as the template. (Bottom row) Subject 11 as the template. For each atlas, the left column represents the right lung and the right column represents the left lung. Examination of the average shapes and shape variations suggests that the proposed atlas construction method depends only slightly on a specific subject being selected as the template.
