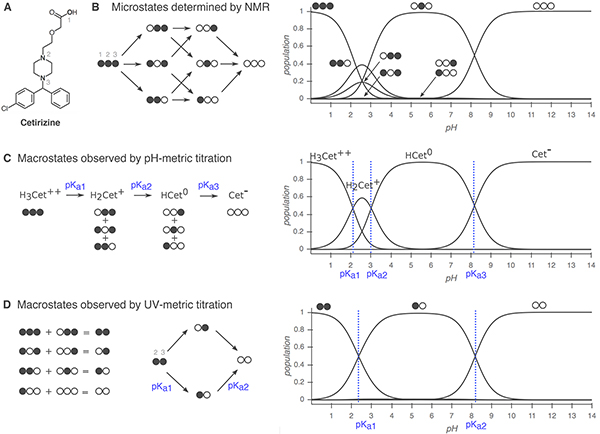
Figure 2. Comparison of macroscopic and microscopic pKa measurement methods.
Filled circles represent protonated sites and empty circles represent deprotonated sites with the order of carboxylic acid (1), piperazine nitrogen (2), and piperazine nitrogen (3). Protonation state populations shown for pH-metric and UV-metric pKa measurement methods are simulations, calculated using NMR-based microscopic pKa values. (A) Cetirizine has n =3 titratable sites, shown in bold. (B) Left: The 8 microstates (2n) and 12 microscopic pKas (n2n−1) of cetirizine. Right: Relative population of microspecies with respect to pH. Potentially all microstates can be resolved via NMR. (C) Simulated pH-metric (potentiometric) titration and macroscopic populations. For a polyprotic molecule, only macroscopic pKas can be measured with pH-metric titration. Microstates with different total charge (related to the number of protons) can be resolved, but microstates with the same total charge are observed as one macroscopic population. (D) Simulated microscopic populations for UV-metric (spectrophotometric) titration of cetirizine. Since only protonation of the titration sites within four heavy atoms of the UV-chromophore is likely to cause an observable change in the UV-absorbance spectra, microstates that only differ by protonation of the distal carboxylic acid cannot be differentiated. Moreover, populations that overlap may or may not be resolvable depending on how much their absorbance spectra in the UV region differ. Both UV-metric and pH-metric pKa determination methods measure macroscopic pKas for polyprotic molecules, which cannot easily be assigned to individual titration sites and underlying microstate populations in the absence of other experimental evidence that provides structural resolution, such as NMR. Note that macroscopic populations observed in these two methods are composed of different combinations of microstates depending on the principles of measurement technique. Here, the illustrative diagram style was adopted from [26], and NMR-determined microscopic pKas for cetirizine were taken from [27].

