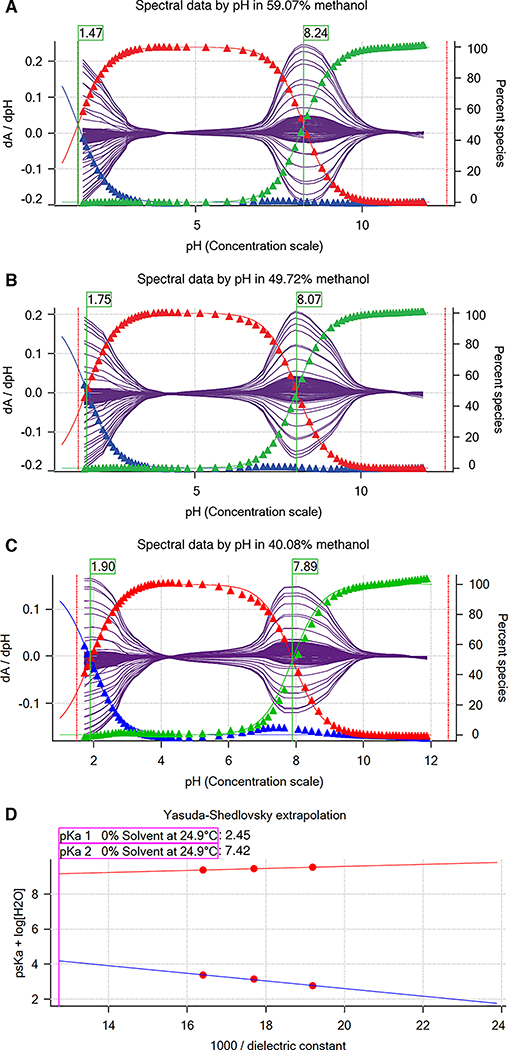
Figure 5. Determination of SM22 pKa values with cosolvent method and Yasuda-Shedlovsky extrapolation.
A, B, and C show psKa of SM22 determined at various methanol concentrations: 59.07%, 49.72%, 40.08% by weight. Purple solid lines indicate the derivative of the absorbance signal with respect to pH vs pH at multiple wavelengths. psKa values (green flags) were determined by Sirius T3 Refine Software. Blue, red, and green triangles show relative populations of macroscopic protonation states with respect to pH calculated from the experimental data. Notice that as cosolvent concentration increases, psKa1 decreases from 1.90 to 1.47 and psKa2 increases from 7.84 to 8.24. D Yasuda-Shedlovsky extrapolation plot for SM22. Red datapoints correspond to psKa determined at various cosolvent ratios. Based on linear fitting to psKa + log[H2O] vs 1/∈, pKa1 and pKa2 in 0% cosolvent (aqueous solution) was determined as 2.45 and 7.42, respectively. R2 values of linear fits are both 0.99. The slope of Yasuda-Shedlovsky extrapolation shows if the observed titration has acidic (positive slope) or basic (negative slope) character dominantly, although this is an macroscopic observation and should not be relied on for annotation of pKas to functional groups (microscopic pKas).

