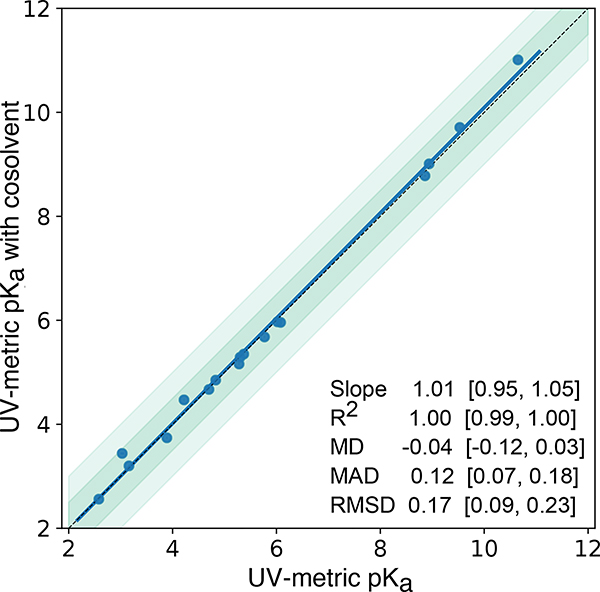
Figure 7. pKa measurements with UV-metric method with cosolvent and UV-metric method in water show good correlation.
17 pKa values (blue marks) of 13 chemicals were measured with both UV-metric pKa method in water and UV-metric pKa method with methanol as cosolvent (Yasuda-Shedlovsky extrapolation to 0% methanol). Dashed black line has slope of 1, representing perfect correlation. Dark and light green shaded areas indicate ±0.5 and ±1.0 pKa unit difference regions, respectively. Error bars are plotted as the SEM of replicate measurements, although they are not visible since the largest SEM is 0.04. MD: Mean difference, MAD: Mean absolute deviation, RMSD: Root-mean-square deviation. Confidence intervals (reported in brackets) report the 95%ile CI calculated over 10 000 bootstrap samples. Experimental data used in this plot is reported in Supplementary Table 4.

