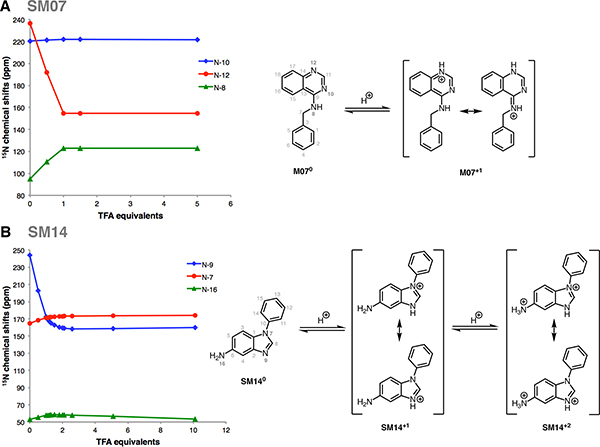
Figure 8. Dominant protonation microstates of SM07 and SM14 characterized by NMR.
(A) Sequence of protonation sites of SM07 were determined by1 H-15N HMBC experiments in 1:2 water:methanol mixture. Left: The plot of15N chemical shifts of the N-10, N-12, and N-8 resonances of SM07 vs titrated TFA-d equivalents, showing the mono-protonation of N-12 as evidenced by its large upfield chemical shifts change. Acidity of the medium increased as more equivalents of TFA-d were added. Electronic effects due to protonation of N-12 caused downfield chemical shift change of N-10 and N-8 between 0–1 equivalents of TFA-d. Right: NMR-based model of the order of dominant protonation states for SM07. The protonation event was only observed at N-12. Microstates shown in the figure are the most likely contributors to the UV-metric pKa of 6.08 ± 0.01. (B) Sequence of protonation sites of SM14were determined by1 H-15N HMBC experiments in acetonitrile. Left: The plot of 15N chemical shifts of N-9, N-7, and N-16 of SM14 vs titrations of TFA-d equivalents, showing two sequential protonation events. The first protonation occured at N-9; a large upfield chemical shift change of 71.6 ppm was seen between 0–1 equivalents of TFA-d. Downfield chemical shift changes observed for N-7 and N-19 in this region were due the electronic effect from the protonation of N-9. N-16 also exhibited a small upfield chemical shift change of 4.4 ppm between 2.5–10 equivalents of TFA-d, which indicated N-16 as the second site of protonation. Right: NMR based model of the order of dominant protonation states for SM14, showing two sequential protonation events. Also, two pKa values were detected with UV-metric pKa measurements for SM14. Assuming that the sequence of protonation events will be conserved between water and acetonitrile solvents, SM140 and SM14+1 microstates shown in the figure are the major contributors to the UV-metric pKa value 5.30 ± 0.01. SM14+1 and SM14+2 microstates shown in the figure are the major pair of microstates contributing to the UV-metric pKa value 2.58 ± 0.01. There could be minor microstates with very low populations that could not be distinguished in these NMR experiments.

