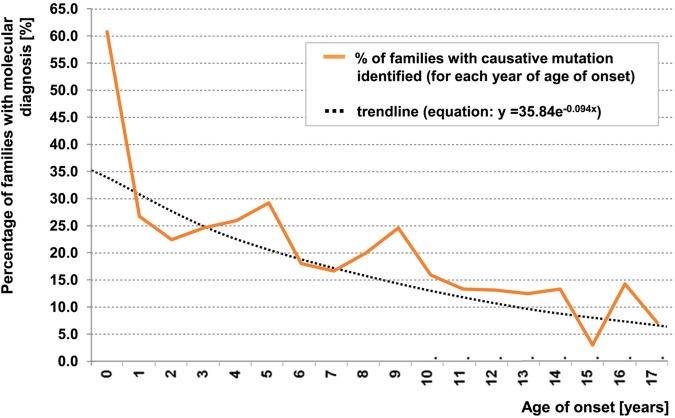
FIGURE 2:
Age of onset distribution (in years) for 1589 of 1783 examined families with SRNS [49]. A total of 1589 individuals from different families manifested with SRNS before 18 years of age. Graph indicates percentage of solved families per year of age of onset. Black dotted line represents a binomial fit of age-related percent of families with causative mutation (in families with more than one affected family member, the mean age of onset from all affected individuals was used).

