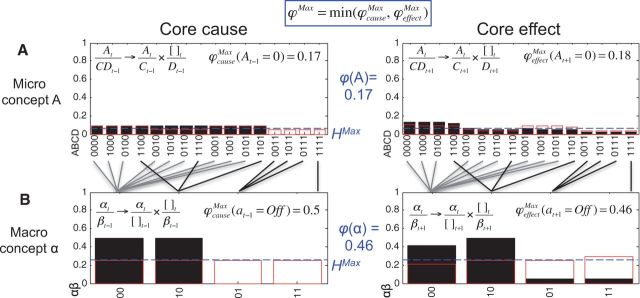
Figure 3.
How the macro beats the micro. A comparison of a micro concept of Fig. 2 to its supervening macro concept. (A) The core cause–effect repertoires of element {A} which have been expanded over the whole system, with their respective MIP shown in the upper left corners. The unpartitioned repertoires are in solid black, while partitioned repertoires are in red. The dotted blue line shows where the maximum entropy distribution lies. (B) The expanded core cause–effect repertoires of element {α}, which supervenes on {A, B}. Comparing the macro cause–effect repertoire to the micro, it is obvious that selectivity (distance of the distribution to maximum entropy) is much higher for the coarse-grained mechanism, which ultimately leads to higher for the macro concept.

