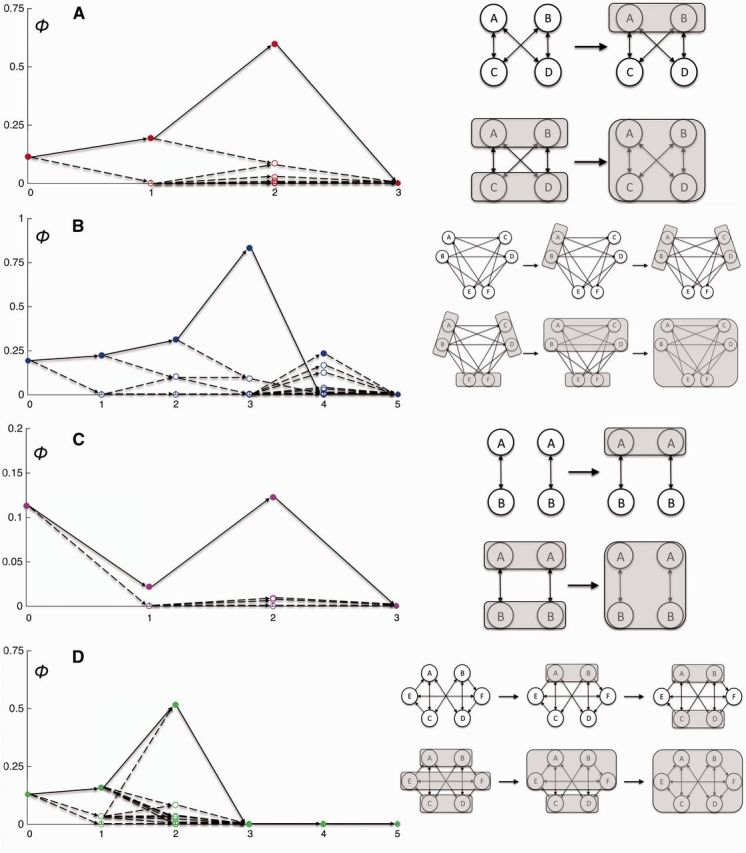
Figure 7.

Finding spatial and temporal maxima. (A) All possible spatial groupings of the four-element system from Fig. 2. (B) All possible spatial groupings of the six-element system from Fig. 4. (C) All possible temporal groupings for the two-element system in Fig. 5. (D) All possible spatial groupings for the six-element system in Fig. 6. For each of the four systems previously examined, the coarse grains at each possible spatiotemporal level are plotted against their Φ values (y-axes) on the left of the figure. The x-axes represent the levels of the system: level 0 being the micro level, level 1 being a single grouping of two micro elements and so on as the degree of coarse-graining increases until all the elements have been grouped into one macro element (which always has a Φ = 0). In the left plots, the solid color data points represent the maximum Φ value of all the groupings at that particular level. The relationships between levels are shown as arrows: each represents a further grouping of a lower level. Note that in each example system the path from the micro level to the grouping with ΦMax (tracked by solid arrows) includes the maximum Φ value at almost every level (except the example shown in B at level 4).
