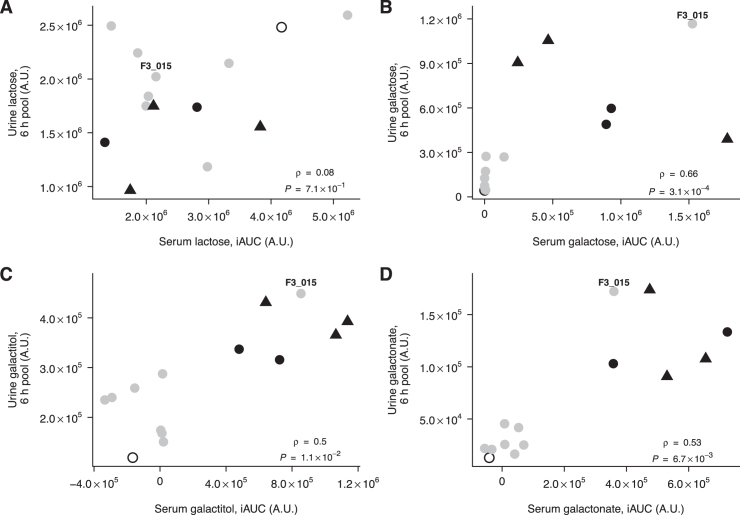
FIGURE 2.
Correlation between postprandial serum and urine lactose (A), galactose (B), galactitol (C), and galactonate (D) after milk intake in 14 subjects. Partial Spearman's correlation test controlling for lactase persistence. Participants with CC (grey circles, n = 8), CT (black circles, n = 2), TT (black triangles, n = 3), or nondetermined (unfilled circle, n = 1) genotype at rs4988235. Subject F3_015 is indicated on the figure. iAUC, incremental area under the curve.

