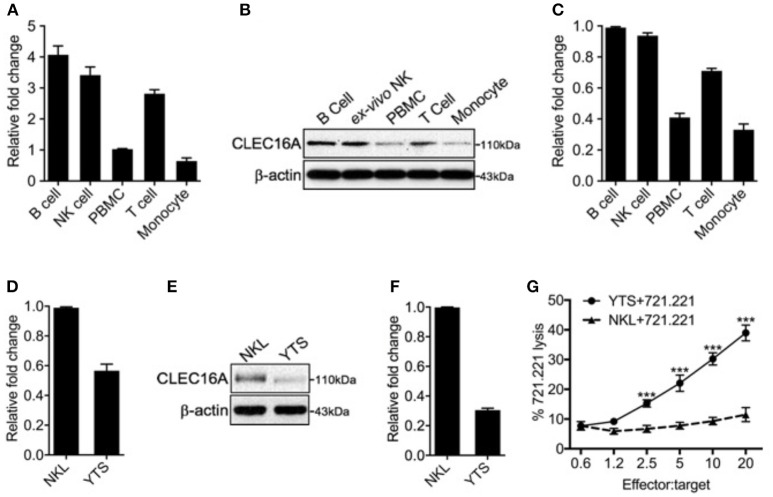
Figure 1.
Differential CLEC16A expression in human immune cells and NK cell lines. (A) Relative CLEC16A mRNA expression in human B, NK, PBMC, T-cells, and monocyte by RT-PCR (n = 3 repeats). (B) Representative Western blot analysis from human B, NK, PBMC, T-cells, and monocytes for CLEC16A expression. (C) Quantitation graph depicting CLEC16A protein expression (n = 3 repeats). (D) Relative CLEC16A mRNA expression by RT-PCR in two immortalized human NK cell lines (NKL and YTS). (E) Representative Western blot depicting CLEC16A expression in NKL and immortalized NK cell lines. (F) Quantitation graph depicting CLEC16A protein expression (n = 3 repeats). (G) Cytotoxicity graph depicting killing of 51Cr-labeled 721.221 using YTS and NKL as effectors. Data represents means ± SE of five independent experiments (n = 5). CLEC16A mRNA expression was normalized to β-actin. The top panel of immunoblot shows CLEC16A expression. Membranes were stripped and re-probed for β-actin as a loading control (bottom panel). ***P < 0.001 (unpaired two-tailed Student's t-test).

