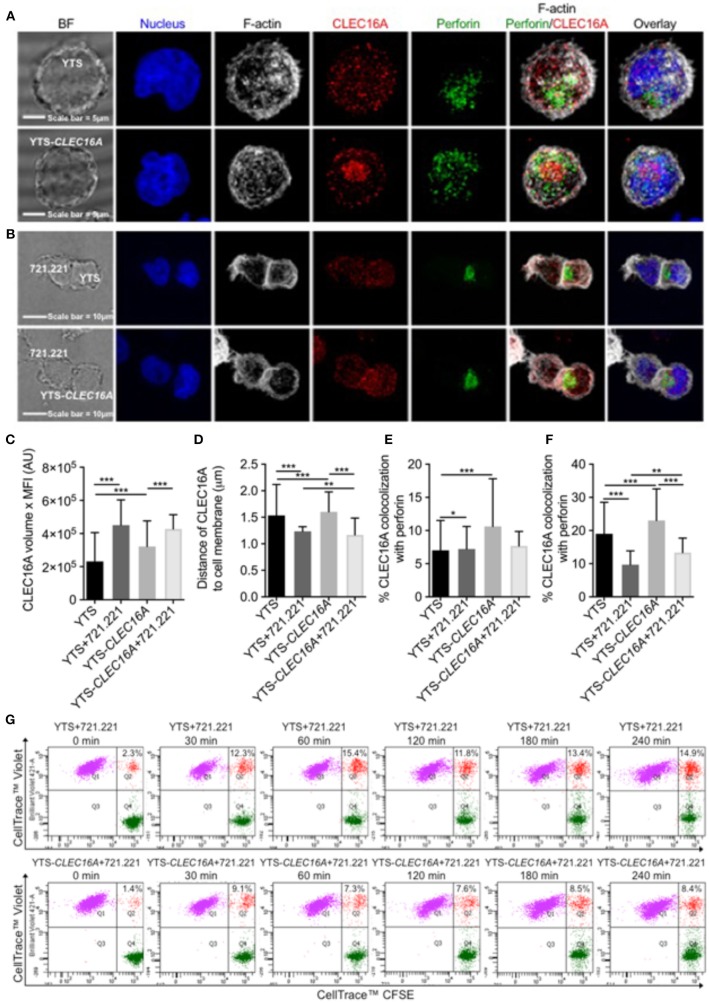
Figure 3.
Overexpression restrains conjugate formation and migration in YTS-CLEC16A. (A) Representative confocal microscopy images of unconjugated YTS (top panel) and YTS-CLEC16A (bottom panel) cells demonstrating localization of CLEC16A. Images are z-projections, except the BF which is a single image taken at the plane of the glass; scale bar = 5 μm; BF = bright field. (B) Representative confocal microscopy images of conjugates formed between YTS and 721.221 (top panel) and YTS-CLEC16A and 721.221 (bottom panel). Effectors and targets were incubated at 37°C for a total of 30 min at an E:T ratio of 1:2. Scale bar = 10 μm. (C) Total amount of CLEC16A per-cell, (D) Mean distance of CLEC16A vesicles to cell membrane per cell, (E) Percent of CLEC16A vesicles colocalized with perforin vesicles, and (F) Percent of perforin vesicles colocalized with CLEC16A vesicles, for effectors alone or effectors in conjugate with 721.221 (after 30 min of conjugation). A total of 200–600 cells were analyzed for effectors alone and 15–25 cells for effectors in conjugate per condition in each experiment. Results show are mean ± SE of three independent experiments determined using an unpaired two-tailed Student's t-test; *p < 0.05, **p < 0.01, ***p < 0.001. (G) Effect of CLEC16A overexpression on conjugate formation. The percent of YTS and 721.221 conjugates formed in a time course experiment, shown in upper panel. The percent of YTS-CLEC16A NK cells bound to 721.221 targets in a time course experiment (bottom panel). The time series is representative of three independent repeats. Data represents means ± SE of three independent experiments. CLEC16A overexpression in YTS-CLEC16A results in decreased conjugate formation with 721.221 targets in comparison to parental YTS.

