Figure 5.
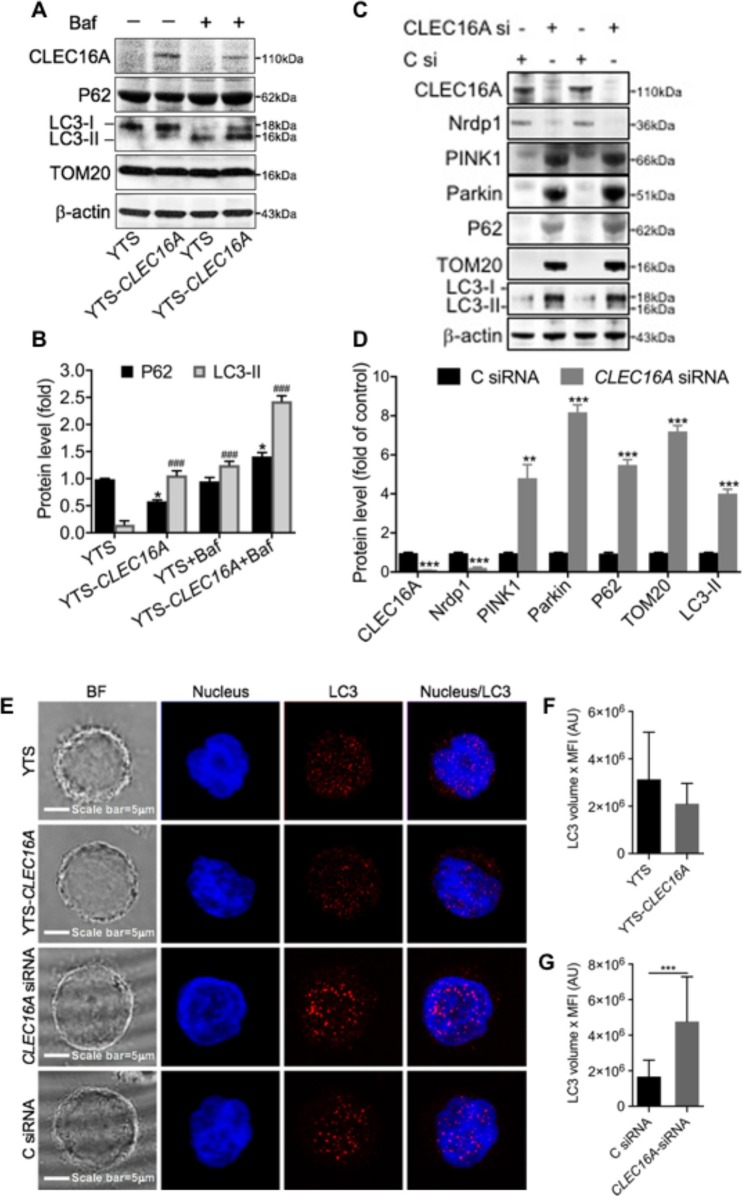
CLEC16A overexpression promotes autophagy and knockdown promotes disrupted mitophagy. (A) Representative Immunoblot depicting expression of ClEC16a, P62, LC3-I/II, and TOM20 from whole cell lysates of YTS, YTS-CLEC16A ± Bafilomycin. Membrane was stripped and reprobed for β-actin as loading control, shown in bottom panel. (B) Quantitation graph depicting P62 and LC3-II expression (n = 3 repeats). (C) siRNA mediated CLEC16A knockdown leads to disrupted mitophagy. Representative immunoblot blot for CLEC16A, Nrdp1, PINK1, Parkin, P62 TOM20, LC3-I/II expression from the whole cell lysates of YTS post 24 h of nucleofection with control and CLEC16A-siRNA. β-actin was probed as loading control. (D) Quantitation graph depicting CLEC16A, Nrdp1, PINK1, Parkin, P62 TOM20, LC3-I/II expression (n = 3 repeats). (E) CLEC16A knockdown leads to increased accumulation of autophagy marker LC3. Representative confocal microscopy images of YTS, YTS-Clec16a, Clec16a-siRNA and C siRNA cells depicting LC3 staining. Images are z-projections, except the BF which is a single image taken at the plane of the glass; scale bar = 5 μm; BF = bright field. (F) Total amount of LC3 per-cell in YTS and YTS-Clec16a and (G) Clec16a siRNA and C siRNA nucleofected YTS cells. A total of 20-33 cells were analyzed per condition in each experiment. Data represents means±SE of five independent experiments. *P < 0.05, ###p < 0.001, **P < 0.01, ***p < 0.001 (unpaired two-tailed Student's t-test).

