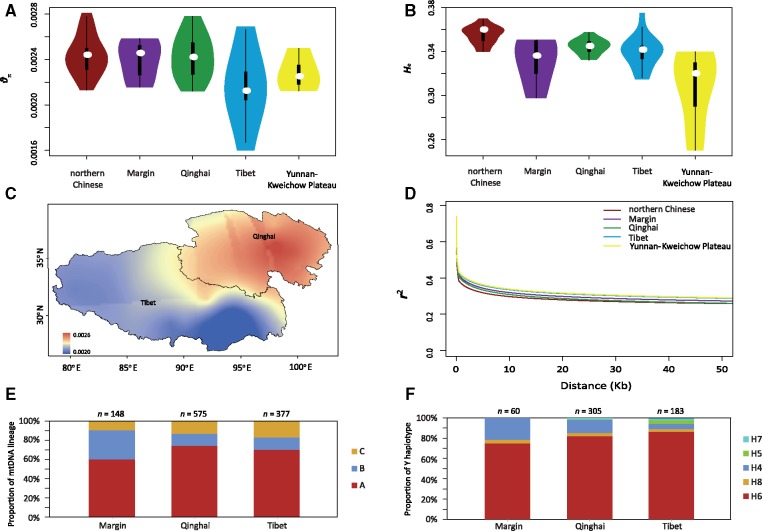
Fig. 2.
Geographic pattern of genetic diversity for Chinese sheep. (A) Nucleotide diversity (θπ) distributions in Chinese sheep groups and Tibetan sheep subgroups from various regions of China. The white dot indicates the median value of each group/subgroup. (B) Heterozygosity (He) distributions in Chinese sheep groups and Tibetan sheep subgroups from various regions of China. The white dot indicates the median value of each group/subgroup. (C) Synthetic maps illustrating the geographic variation in nucleotide diversity (θπ) in the Tibet and Qinghai subgroups of Tibetan sheep. (D) Linkage disequilibrium (LD) decay for five geographic groups/subgroups of populations measured by r2. (E) The proportions of mtDNA lineages in the three subgroups of Tibetan sheep (Tibet, Qinghai, and margin subgroups). (F) The proportions of Y-chromosome haplotypes in three subgroups of Tibetan sheep (Tibet, Qinghai, and margin subgroups).

