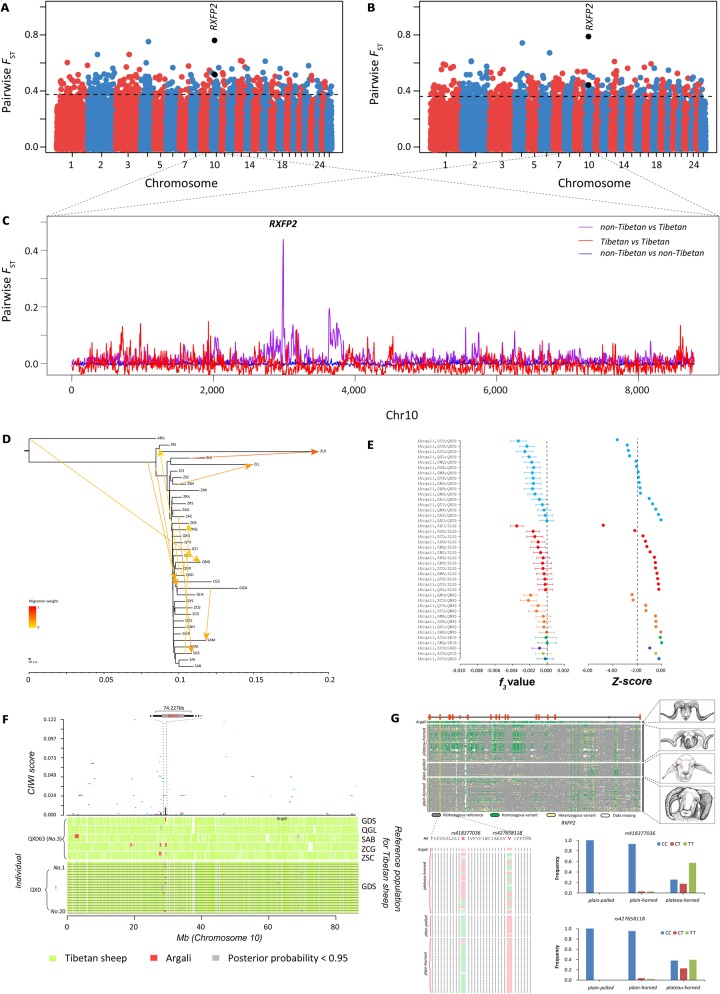
Fig. 4.
Identification of genomic regions at the RXFP2 locus introgressed into Tibetan sheep from argali. (A) Genome-wide distribution of pairwise FST values between plain-polled and plateau-horned sheep computed by the Ovine SNP50K arrays (see detailed information in supplementary table S36, Supplementary Material online). (B) Genome-wide distribution of pairwise FST values between plain-horned and plateau-horned sheep computed by the Ovine SNP50K arrays (see detailed information in supplementary table S37, Supplementary Material online). (C) Smoothed FST values between the Tibetan and non-Tibetan sheep populations across chromosome 10. (D) Inferred neighbor-joining phylogenetic tree showing the genetic relationships among Chinese sheep populations with 10 migration edges. ARG (Ovis ammon) was used as the outgroup to root the tree. (E) Outgroup f3 statistics between ARG and all Tibetan sheep populations using the Ovine SNP50K arrays, with significant results (f3 value < 0) shown on the figure. (F) Evidence of introgression at the RXFP2 locus identified by PCAdmix and CIWI approaches. The distribution of the concordance score (A-scores) and CIWI score across chromosome 10 is plotted at the top of the panel and indicates the concordance of ancestry assignment among 20 individuals from a Tibetan sheep population (Dulan population, QXD). The A-scores estimated by five alternative reference populations (Guide [GDS], Maqin [QGL], Hongyuan [SAB], Gonjo [ZCG], and Comai population [ZSC]) are displayed by five colored segments, and the CIWI score inferred from the A-score is shown by the black line. Distribution of PCAdmix results for QXD63 (No. 3) across chromosome 10 is shown on the middle of the panel. PCAdmix results of QXD63 (No. 3) were estimated by five alternative reference populations (GDS, QGL, SAB, ZCG, and ZSC). The distribution of PCAdmix results of 20 individuals from QXD across chromosome 10 is plotted at the bottom of the panel. GDS was used as a reference population to perform the PCAdmix analysis. (G) The patterns of genotypes of the introgressed genomic region (chr10: 29,435,112–29,509,145) among 165 domestic sheep and 4 argali as well as the horn type phenotype (also see supplementary fig. S21, Supplementary Material online) are shown on the top. The alignment of protein sequences from the RXFP2 genes from 165 domestic sheep and 4 argali is plotted at the lower left. The amino acids of two nonsynonymous substitutions (rs418377036 and rs427658118) in the sheep reference genome Oar v.4.0 are marked in red. Amino acids identical to or different from those in the reference genome are indicated by green and pink, respectively. The genotype frequency distributions of rs418377036 and rs427658118 among sheep groups with different horn phenotypes are plotted at the lower right.

