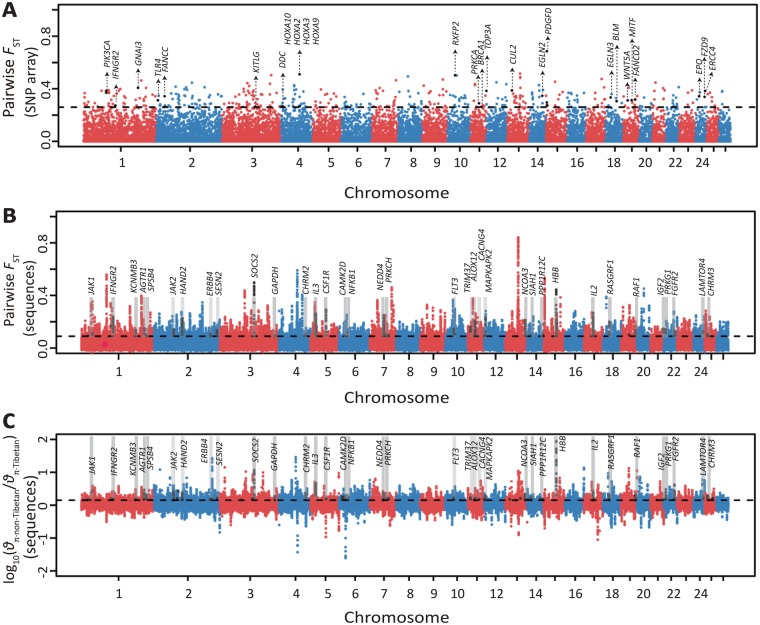
Fig. 6.
Manhattan plot of selective sweeps in the Tibetan sheep. (A) Genome-wide distribution of pairwise FST values between Tibetan sheep and non-Tibetan sheep computed using the Ovine SNP50K arrays (see detailed information in supplementary table S33, Supplementary Material online). The threshold value corresponding to the top 1% of the FST value (FST = 0.26) is shown as the horizontal dashed line. The black dots indicate the significant sites that harbor candidate positively selected genes. (B) Genome-wide distribution of pairwise FST values between Tibetan sheep and non-Tibetan sheep computed using the sequence data set (see detailed information in supplementary table S34, Supplementary Material online). (C) Distribution of log10(θπ·ratios) between non-Tibetan sheep and Tibetan sheep estimated by the sequence data set (see detailed information in supplementary table S34, Supplementary Material online). The top 5% genome-wide significant threshold values of pairwise FST (FST = 0.0846) and log10(θπ·non-Tibetan/θπ·Tibetan) [log10(θπ ratio) = 0.1502] for the sequence data set are shown separately by black dashed lines in (B) and (C), respectively.

