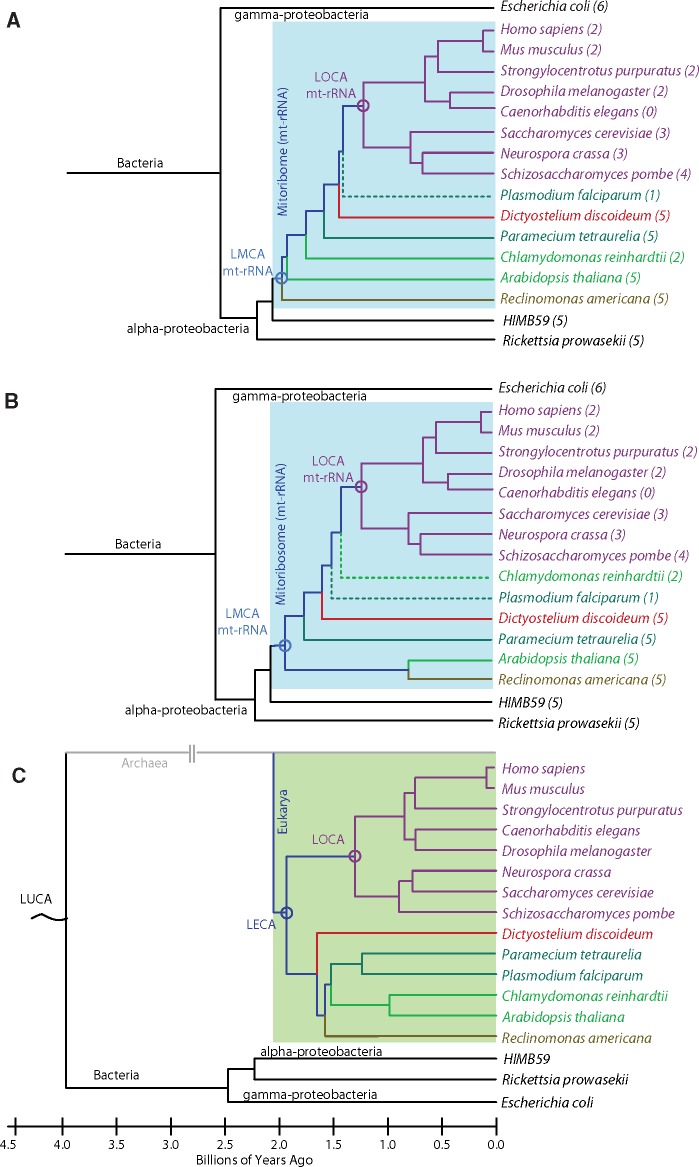
Fig. 1.
Phylogenies of mitoribosomal and eukaryotic evolution. Phylogenetic trees generated from reconstruction of mt-LSU rRNA sequences by (A) the maximum parsimony and (B) maximum likelihood methods using MEGA7 (Kumar et al. 2016). The numbers in parentheses indicate mt-rRNA zone number as depicted in figure 2. (C) Canonical phylogenetic tree of a subset of eukaryotic species obtained from the interactive tree of life (iTOL; (Letunic and Bork 2016)) mapped onto an evolutionary timeline and colored by clade: Opisthokonta (purple), Alveolata (teal), Amoebozoa (red), Archaeplastida (green), and Excavata (brown). The Plasmodium falciparum and Chlamydomonas reinhardtii branches are dashed in the mt-LSU rRNA reconstructions, as they do not follow the canonical topology. Bacterial ancestors and extant bacterial species are shown in black. Approximate ages of nodes were obtained from the Time Tree project (Hedges et al. 2015; Kumar et al. 2017). Last universal common ancestor (LUCA), last eukaryotic common ancestor (LECA), last mitochondrial common ancestor of rRNA (LMCA mt-rRNA), last opisthokontal common ancestor of mt-rRNA (LOCA mt-rRNA).

