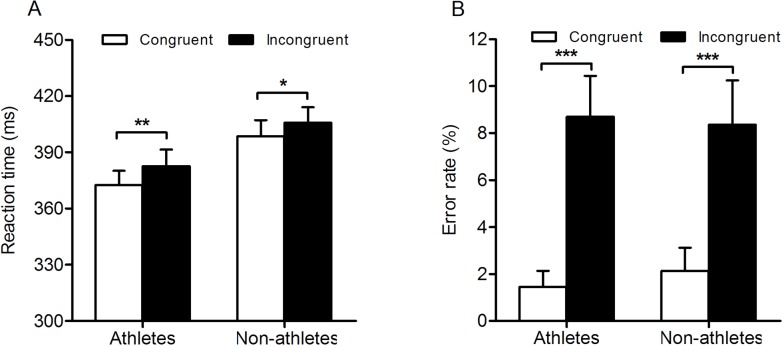
Figure 4. Response times and error rates in the two groups for the conscious response priming task.
Overview of the mean reaction time (A) and error rate (B) for athletes and nonathletes in experiment 2. Bars represent the mean reaction times and error rates as a function of response congruency and expertise. White bars indicate reaction times and error rates on congruent trials, and black bars indicate reaction time and error rate on incongruent trials. Error bars represent SEM.

