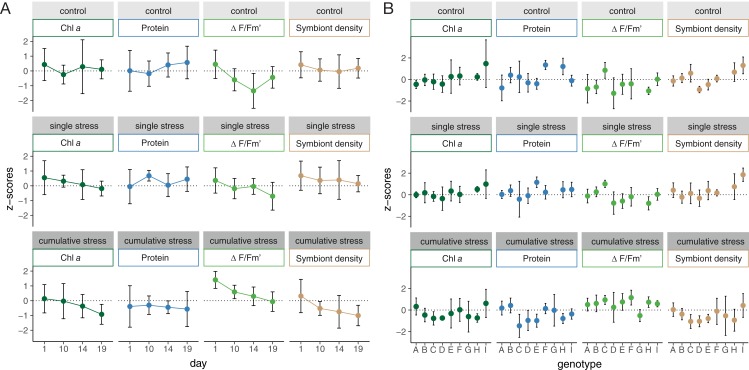
Figure 2. Physiological response of Acropora tenuis under control, single stress, and cumulative stress treatments.
Variations in the chlorophyll a (Chl a) concentration, protein concentration, effective quantum yield (ΔF/Fm′) and symbiont cell density (Symbiont density) of A. tenuis (A) over time (day 1, 10, 14, and 19) and (B) between individual host-genotypes (A–I). Physiological parameters are z-score standardized and error bars represent standard deviations.

