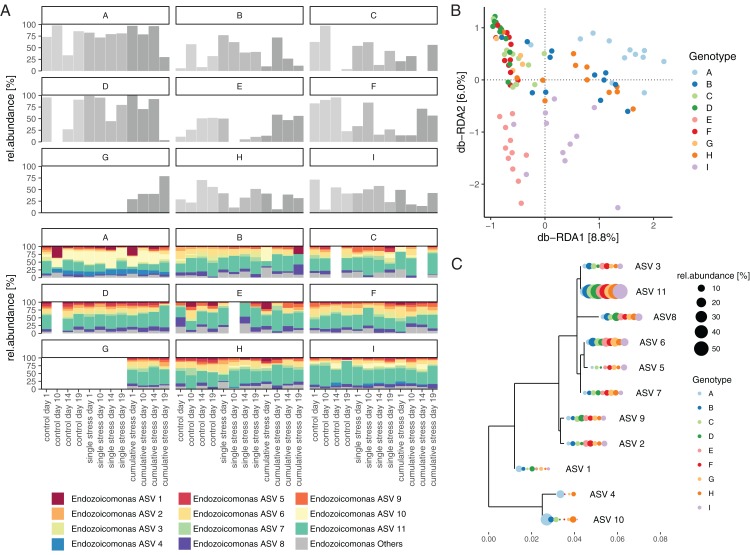
Figure 5. Composition and distribution of Endozoicomonas assemblages.
(A) Total relative abundance of Endozoicomonas and the relative abundance distribution of the 11 most abundant Endozoicomonas ASVs associated with individual coral nubbins of each host genotype (A–I) under control, single stress, and cumulative stress conditions over time (day 1, 10, 14, and 19). (B) Distance-based Redundancy Analysis (db-RDA) quantifying the contribution of host-genotype to significantly explaining the observed compositional variation of the Endozoicomonas microbiome. (C) Phylogenetic tree of the 11 most abundant Endozoicomonas ASVs (including the ubiquitously present ASV 11) and their average relative abundance within a host genotype.

