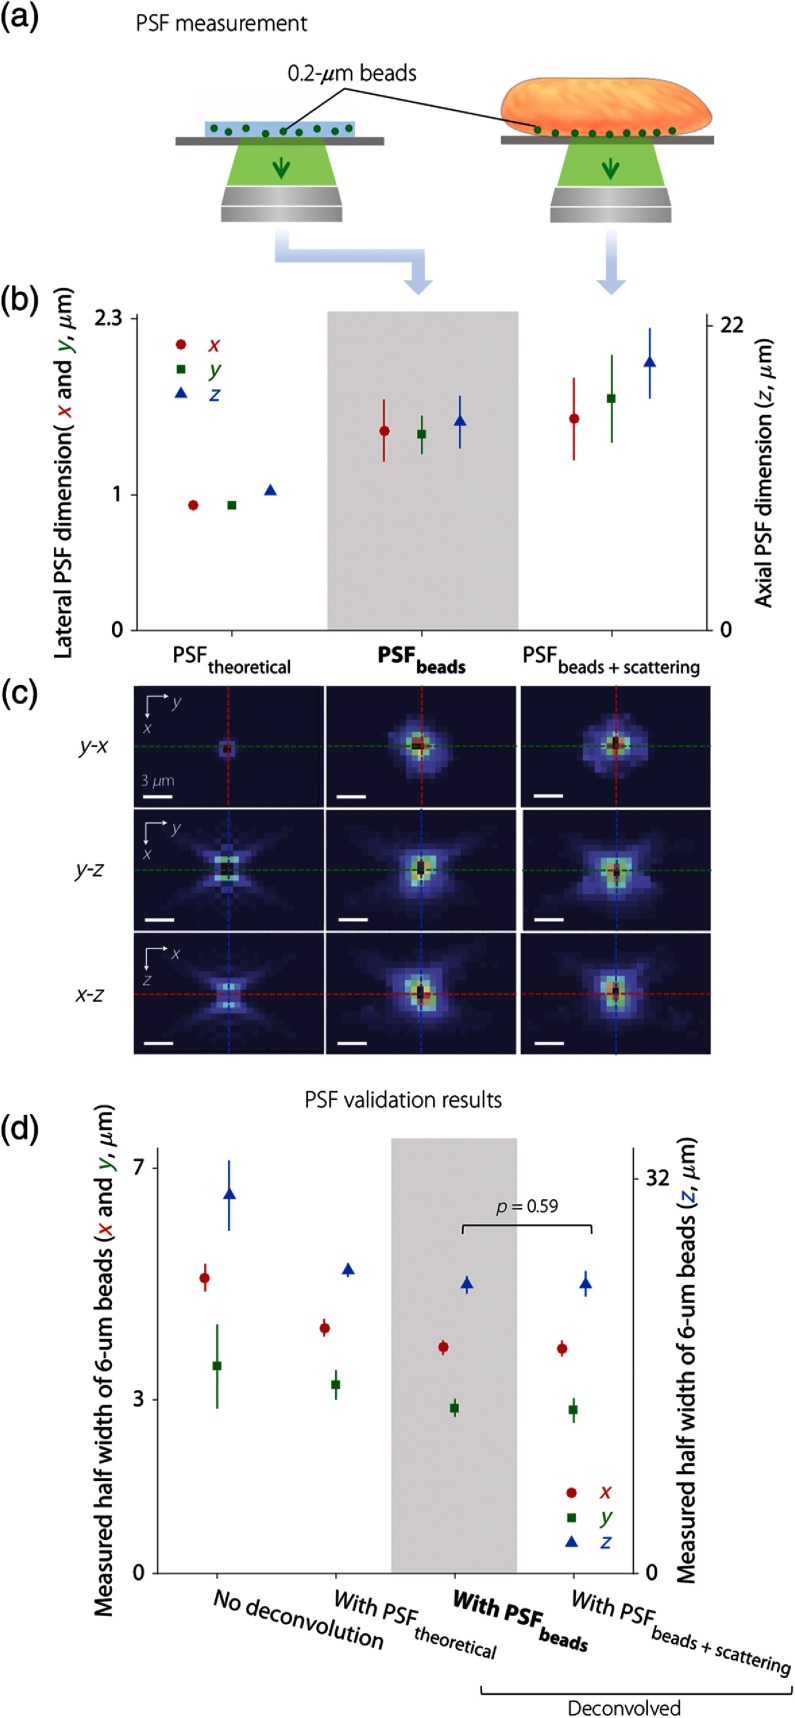
Fig. 3.
Obtaining and validating a PSF for deconvolution. (a) Illustration of two PSF measurement methods, one of which images subresolution fluorescent beads (, emission peak at 520 nm) in an agarose phantom (standard method) and another of which images the same beads at the surface of human breast tissue (which adds the effects of tissue scattering). (b) Results showing the FWHM of the PSF theoretically calculated from system parameters (), the average PSF experimentally measured with beads in an agarose phantom (), and the average PSF experimentally measured with beads at the tissue surface (). (c) Three orthogonal cross-sectional views of , , and . The colors of the dashed lines correspond to the colors of the data points in (b) and (d) for the , , and directions (red, green, and blue, respectively). Scale bar: . (d) PSF validation results showing the average FWHM of beads at a tissue surface without deconvolution, and with deconvolution using three different PSFs. The use of for deconvolution yields the best results regarding resolution and variance. While is more accurate, it does not provide improved deconvolution results (as shown by the -value). (b) and (d) Left vertical axis: FWHM in the and directions (red and green). Right vertical axis: FWHM in direction (blue).

