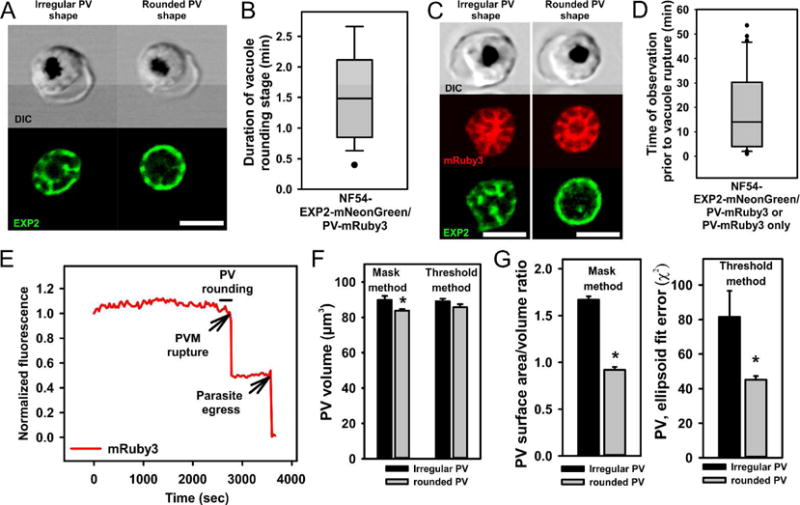
Fig.2. Transition of the irregularly shaped parasitophorous vacuole into a short-lasting rounded shape.

A. A representative schizont approaching the rounded vacuole stage (left images) and during the rounded stage (right images). Note the peripheral location of Exp2-mNeonGreen signal in the rounded but not in the irregular shaped schizont/vacuole. B. The length of the rounded vacuole stage measured in 27 recordings of natural parasite egress. Double-tagged parasites were used for time-lapse recordings. Data distribution is shown as a box and whisker diagram with outliers. Mean +/−SEM=1.60+/−0.21 min. C. Irregular (left panel) and rounded-shaped (right panel) vacuole have the same high intensity of mRuby3 fluorescence (vacuolar lumen marker), indicating a preservation of PVM integrity. D. Monitoring of the vacuolar fluorescence prior to PVM rupture. Duration of live time-lapse recordings starting from the initiation of recording until the time of parasite egress (n=36). E. An example of the integrated cell fluorescence, calculated from each frame in time series and then normalized to the first time point. All cells showed a stable mRuby3 fluorescence up to the moment of PVM rupture. The second drop of fluorescence is associated with parasite egress from the infected erythrocyte. F-G. The vacuolar volume (F) and sphericity (G) calculated from fluorescence serial Z-sections of schizonts before and during the rounded stage (see Experimental procedures section). Quantitative analysis supports visual conclusion of vacuole rounding and shows a slightly diminished vacuolar volume in rounded stage schizonts (1.4% and 6.7% decrease in two independent assessment methods, n=5). All scale bars are equal 5 μm
