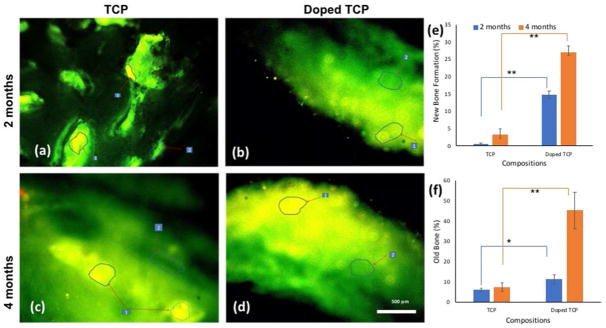
Figure 7.
Fluorochrome labeling images depicting scaffolds implanted in the proximal tibia over the course of 120 days. a. TCP 2 months’ b. Doped TCP 2 months c. TCP 4 months d. Doped TCP 4 months. Areas marked with numbers depict the different osseous tissue zones (1. Golden yellow fluorescence- new bone 2. Sea green fluorescence- old bone). (e) and (f) show percentage old and new bone formation calculated from fluorochrome labeled micrographs using GNU Manipulation Program (GIMP). ** depicts extremely significant statistical relevance performed using Students’ paired t tests (p values <0.0001) and * depicts significant relevance performed by Students’ paired t-test as well (p value <0.05).

