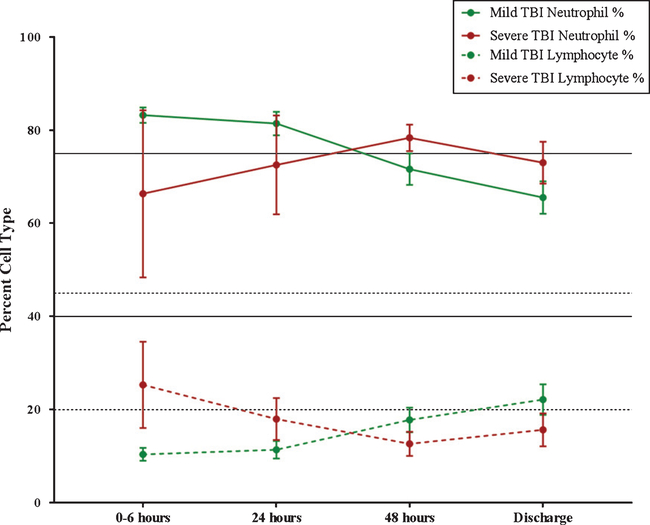
Fig. 3.
Neutrophil and Lymphocyte Dynamics Following TBI. Neutrophil percentage is graphed as a solid line: solid green = mild TBI, solid red = severe TBI. Solid black lines on the graph indicate the normal range of neutrophil percentage (range = 40–75 percent). Lymphocyte percentage is graphed as a dashed line: dashed green = mild TBI, dashed red = severe TBI. Dashed black lines on the graph indicate the normal range of lymphocyte percentage (range = 20–45 percent).

