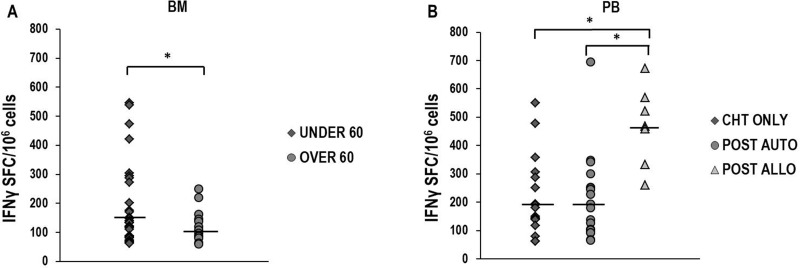
Figure 3. NPM1-mutated-specific immune responses according to patients' age and post-remissional treatments.
Comparison of IFNγ-producing specific T-cell responses against 13.9 and 14.9 NPM1-mutated-derived peptides in BM samples obtained from 18 younger (median 140 SFC/106 cells, range 62–546) and 8 older than 60 years patients (median 108 SFC/106 cells, range 80–162) (Panel A). In panel B, the comparisons between IFNγ-producing specific immune responses documented on PB samples from 9 patients who received chemotherapy only (median 180 SFC/106 cells, range 62–550), and from 11 and 6 patients who underwent either autologous (median 180 SFC/106 cells, range 66–696) or allogeneic HSCT (median 468 SFC/106 cells, range 260–672), respectively, are shown. Differences observed were statistically significant (*P < 0.05, Mann–Whitney U Test). Black bars show median values.

