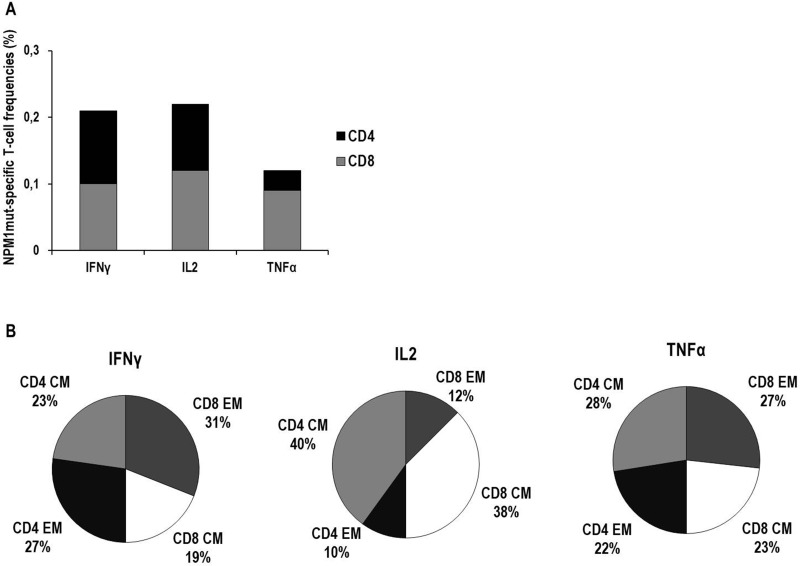
Figure 5. Characterization of cytokine production and memory T-cell profiles of NPM1-mutated specific T cells by cytokine secretion assay (CSA).
Frequencies of NPM1-mutated-specific T cells secreting IFNγ, IL2 or TNFα in BM and PB samples, collected from a total of 18 patients, are expressed as median percentages of CD8+ T cells (gray columns) or CD4+ T cells (black columns) (Panel A). In detail, median frequencies (percentage, range) were as follows: IFNγ–producing CD8+ T cells 0.1% (0.02–0.84), IFNγ–producing CD4+ T cells 0.11% (0.03–0.51), IL2–producing CD8+ T cells 0.12% (0.01–0.62), IL2–producing CD4+ T cells 0.1% (0.01–0.52), TNFα–producing CD8+ T cells 0.09% (0.01–0.91), TNFα–producing CD4+ T cells 0.03% (0.01–0.69). In panel B, the memory T-cell profiles of NPM1-mutated-specific T cells, collectively found in PB and BM samples, are shown. For each cytokine-secreting NPM1-mutated-specific T-cell subset, black portions and light gray portions represent the median percentages of CD4+ effector memory (EM) T cells and CD4+ central memory (CM) T cells, respectively, while dark gray portions and white portions represent the median percentages of CD8+ EM T cells and CD8+ CM T cells, respectively.

