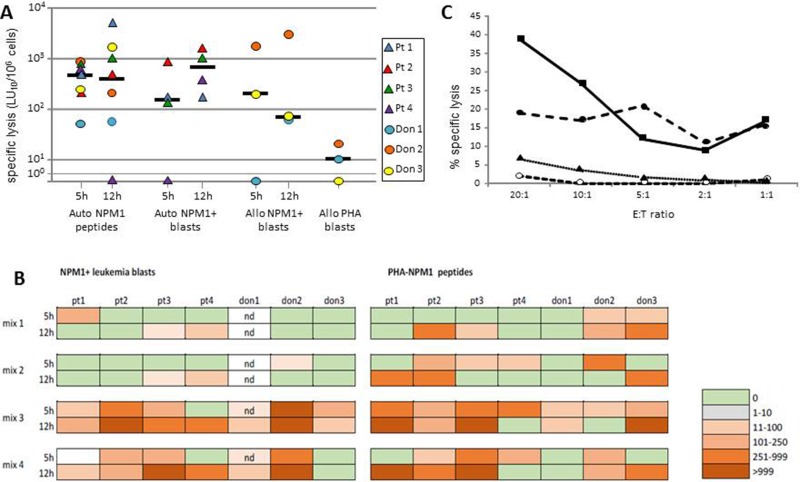
Figure 6. Cytolytic activity exerted by NPM1-specific T cell lines.
Cytotoxic activity of PBMCs after 13-day culture in the presence of NPM1-mutated–derived peptides against autologous PHA blasts pulsed with NPM1-mutated peptides (Auto NPM1 peptides, 5 h- and 12 h-cytotoxicity assay), autologous NPM1-mutated blasts (Auto NPM1 blasts, 5 h- and 12 h-cytotoxicity assay), allogeneic NPM1-mutated blasts (Allo NPM1 blasts 5 h- and 12 h-cytotoxicity assay), allogeneic PHA blasts from the donor of the allogeneic NPM1-mutated blasts (Allo PHA blasts). The results are represented as the number of lytic units per 106 cells (LU10/106) and reported for each subject tested and as median value. LU values referring to lysis of autologous PHA blasts pulsed with NPM1-mutated peptides were calculated after subtraction of background, consisting of cytotoxicity against autologous PHA blasts pulsed with irrelevant peptides (Panel A). Cytotoxic responses to NPM1-mutated+ autologous (patients) or allogeneic (donors) leukemic blasts or to NPM1-mutated peptide-pulsed PHA blasts in the cultures obtained by stimulation with different NPM1-mutated peptide mixtures (mix 1: peptides 2.9 and 4.9; mix 2: peptides 13.9 and 14.9; mix 3; peptides 13.9, 14.9, and 15.11; mix 4: all 18 peptides) in the subjects tested (Panel B). Boxes indicate 5 h- and 12 h-cytotoxicity as LU10/106, according to color intensity from green (0 LU10/106) to bright orange (>999 LU10/106), as reported in the figure. Nd: not done. Cytotoxicity profile of cultured PBMCs obtained from donor 2 (Panel C). The figure reports the percentage of specific lysis against autologous PHA blasts pulsed with NPM1-mutated peptides (dashed line, solid circles) or with control peptides (dashed line, open circles), allogeneic NPM1-mutated blasts (solid line, squares), and allogeneic PHA blasts from the same donor of the NPM1-mutated+ blasts (dotted line, triangles). The mean percent lysis of duplicate wells for 5 different effector-to-target (E:T) ratios is shown.

