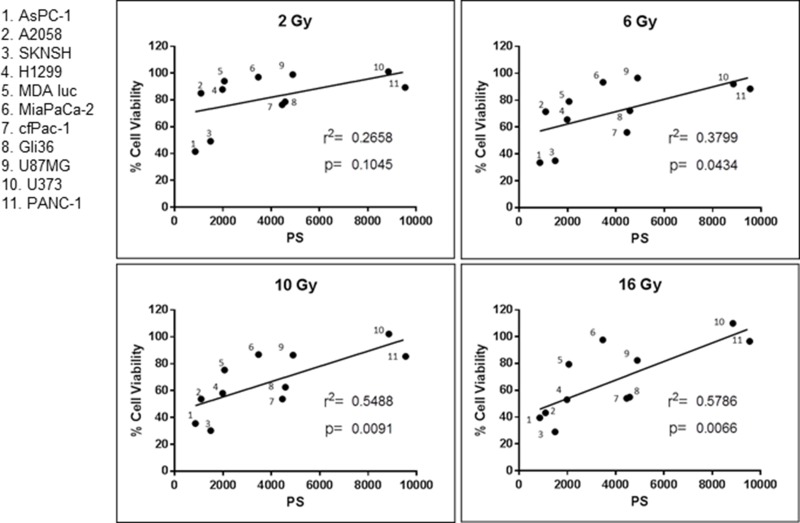
Figure 3. Correlation between cancer cell surface phosphatidylserine (PS) and resistance to radiation.
Surface PS from untreated cells was determined with Annexin V-FITC staining and cell viability was ascertained with the MTT assay. Both assays are described in Materials and Methods. Each dot represents the average of two measurements. r2 and the p values were calculated with GraphPad Prism 6 software.

