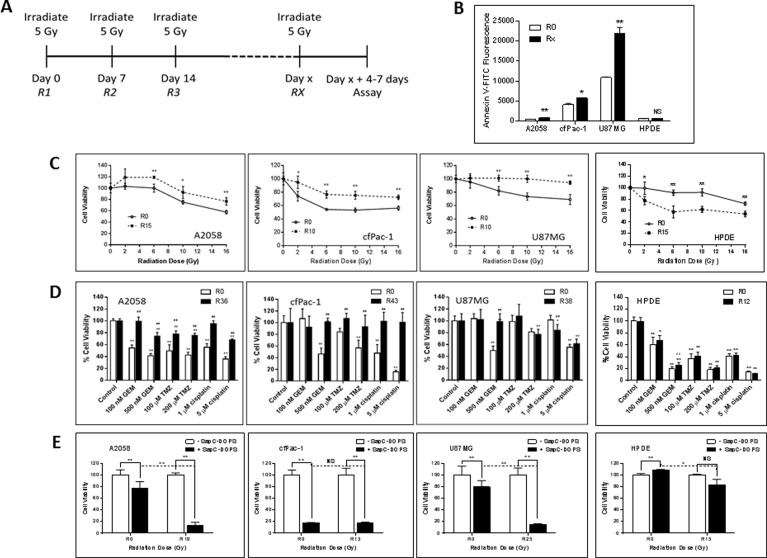
Figure 5. Serially irradiated cells maintain higher surface PS and are less sensitive to subsequent radiation exposure or the effects of chemotherapeutic drugs but are more sensitive to the effects of SapC-DOPS.
A2058, cfPac-1, U87MG and HPDE were irradiated at 5 Gy every week for various numbers of weeks (the Rx is the number of weeks the cells were irradiated. Non serially-irradiated cells are designated R0. The media was changed immediately after the irradiation and the cells were split every 3–4 days. Treatments were given 4–7 days following the last 5 Gy irradiation, when the surface PS is still elevated, (A) Timeline of the treatment regime. (B) Surface PS was determined by Annexin V-FITC staining on Day 4 following the last 5 Gy irradiation. Rx; x = 15 for A2058 and 10 for cfPac-1 and U87MG and 13 for HPDE. *p < 0.05, **p < 0.01 compared to R0. Shown are the mean and S.D. (C–E) Cells were serially irradiated with 5 Gy. (C) 7 days later they were exposed to the indicated doses of radiation and cell viability was determined by MTT assay was performed 72 hr. later. Shown is the % of live cells with 100% as the normalized control for each cell line. *p < 0.05, **p < 0.01, compared to R0. (D) 7 days after the last 5 Gy irradiation, cells were treated with different doses of gemcitabine (GEM) temozolomide (TMZ) or cisplatin and cell viability was determined by MTT assay was performed 72 hr. later. #p < 0.05, ##p < 0.01, compared to R0 at the same dose of drug. (E) 7 days following the last 5 Gy irradiation, cells were treated with the indicated doses of SapC-DOPS (1 SapC:7 DOPS, Mol:Mol) and cell viability was determined by MTT assay was performed 72 hr. later. As in Figure 3, the SapC-DOPS concentration was 25 mM for A2058 and cfPac-1, 40 mM for U87MG and 50 mM for HPDE. Shown are the % of live cells with 100% as the normalized control for each cell line (as well as for the R0 and Rx). *p < 0.05, **p < 0.01, NS = not significantly different.

