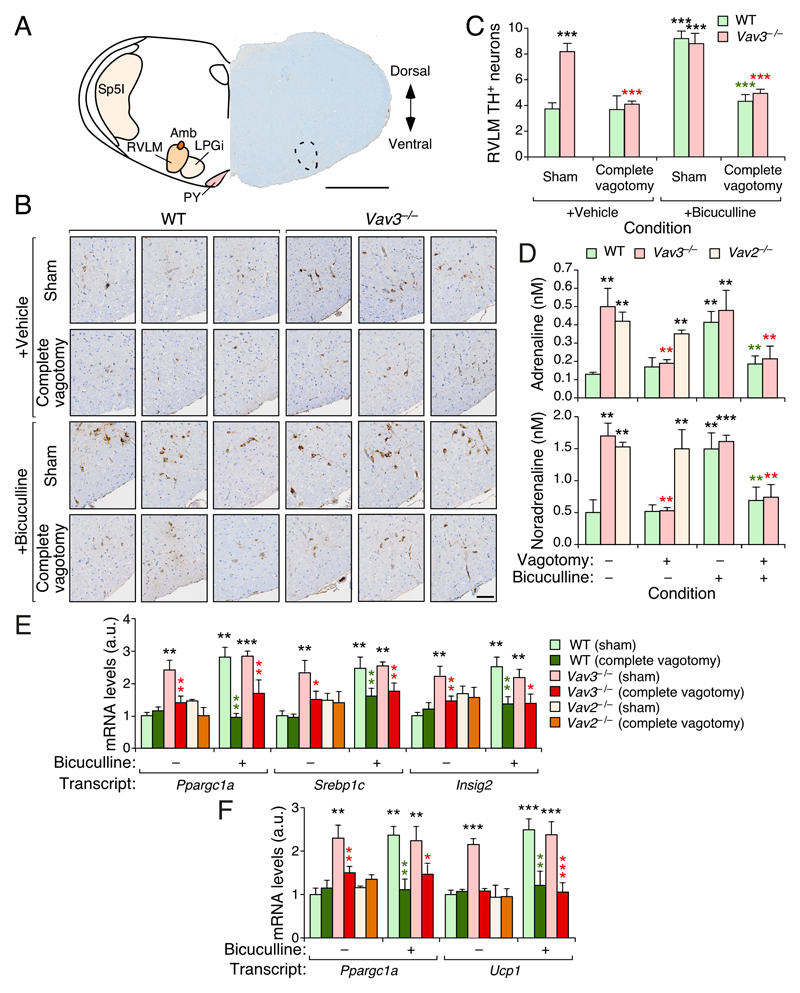
Figure 2. Vav3 deficiency–triggered RVLM hyperactivation requires vagal function.
(A) Scheme (left) and representative (right) coronal brainstem section showing functional areas (left) and the specificity of TH staining within the RVLM (right, encircled area). Amb, nucleus ambiguus; LPGi, lateral paragigantocellular nucleus; PY, pyramidal tract; Sp5I, spinal trigeminal nucleus interpolar. D, dorsal; V, ventral. Scale bar, 1 mm.
(B) Representative immunohistochemical images showing TH+ cells within the RVLM of mice of indicated genotypes and experimental groups. Scale bar, 100 μm.
(C) Quantification of the RVLM TH+ cells from experiments shown in (B).
(D) Plasma catecholamine levels in mice of the indicated genotype, group and treatment.
(E,F) Abundance of the indicated transcripts in liver (E) and BAT (F) extracts from mice of indicated genotypes and experimental groups.
Data shown in panels C–F represent mean ± SEM. *, P ≤ 0.05; **, P ≤ 0.01; ***, P ≤ 0.001 relative to either sham operated WT (black asterisks) or the sham operated animals of the same genotype group (red and green asterisks). ANOVA and Kruskal–Wallis tests were used for data obtained in panels (C,E,F) and (D), respectively. n = 6 (sham operated WT mice), 7 (sham operated WT + bicuculline), 6 (sham operated Vav3–/– mice with and without bicuculine), 7 (vagotomized WT with and without bicuculline), 8 (vagotomized Vav3–/– mice), 9 (vagotomized Vav3–/– mice + bicuculline), and 5 (sham operated and vagotomized Vav2–/– mice).

