Fig. 1.
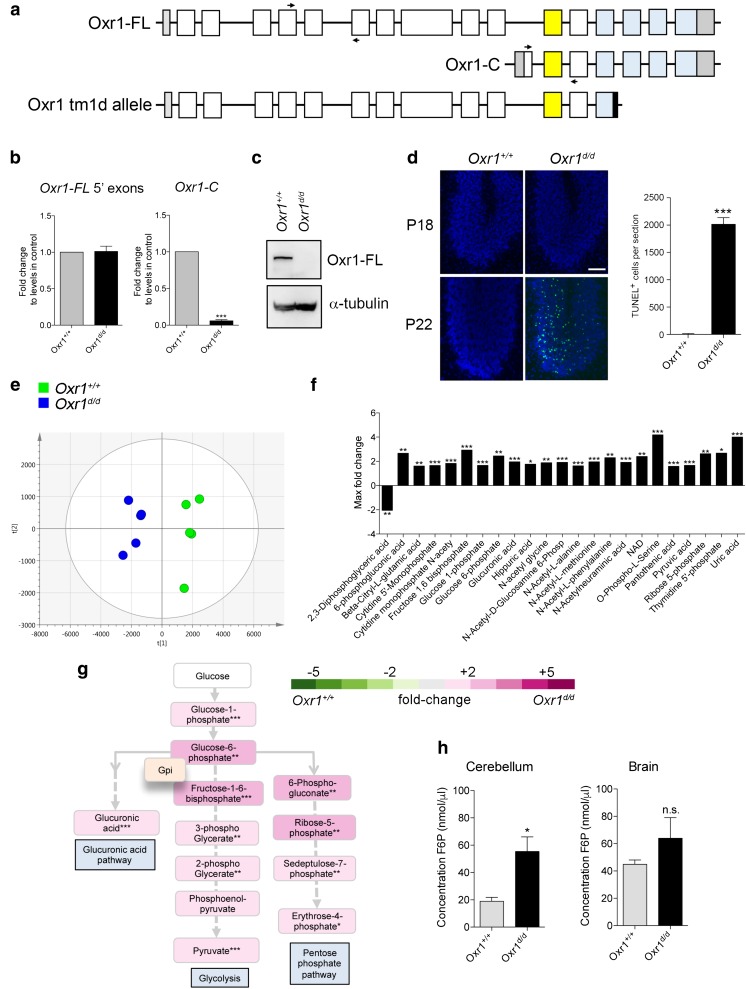
Glucose metabolism is deregulated in Oxr1 knockout mice. a Schematic indicating the exon structure of the longest full-length (FL) and shortest C-terminal (C) Oxr1 isoforms with the relative position of qRT-PCR primers indicated (arrows). The Oxr1 tm1d knockout allele is also shown that truncates all Oxr1 protein isoforms. Coding exons (white), UTRs (grey), an alternatively-spliced exon (yellow), and the TLDc domain (blue) are shown. Not to scale. b qRT-PCR of 5′ exons of Oxr1-FL and the Oxr1-C isoform in the cerebellum of Oxr1d/d mice (N = 4 animals per group). c Western blot of Oxr1-FL protein in cerebellum tissue of homozygous Oxr1d/d mice compared to a wild-type control (Oxr1+/+); alpha-tubulin was used as a loading control. d Representative TUNEL staining of cerebellum sections from Oxr1d/d and littermate control mice at P18 compared to disease end-stage at P24 with quantification of TUNEL-positive cells at P24 (N = 3 animals per group). Scale bar: 200 μm. e PCA analysis of metabolite profiling; each point on the PCA plot represents an individual sample. PCA analysis of metabolite profiles from cerebella of P18 Oxr1d/d (blue) compared to Oxr1+/+mice (green) (N = 5 animals per group). f Twenty-three metabolites significantly dysregulated by more than 1.6-fold in the cerebella of P18 Oxr1d/d compared to Oxr1+/+ mice. Fold-changes are based on per-run abundances for a specific metabolite which were then grouped by experimental condition (N = 4-5 animals per group). g Metabolites dysregulated in the Oxr1d/d cerebellum that are featured in pathways downstream of glucose-6-phosphate isomerase. The fold-changes between Oxr1+/+ and Oxr1d/d mice of the indicated metabolites are colour-coded. The position of the glycolytic enzyme glucose-6-phosphate isomerase (Gpi1) in the pathway is shown. A more detailed representation of the data is shown in Supplementary Fig. 2. h Fructose-6-phosphate levels are increased in the cerebellum but not the remaining brain tissue of Oxr1d/d mice compared to littermate Oxr1+/+ controls (N = 4 animals per group). Panels b, d, and h: t test, panel f, one-way ANOVA: *p < 0.05, **p < 0.01, ***p < 0.001

