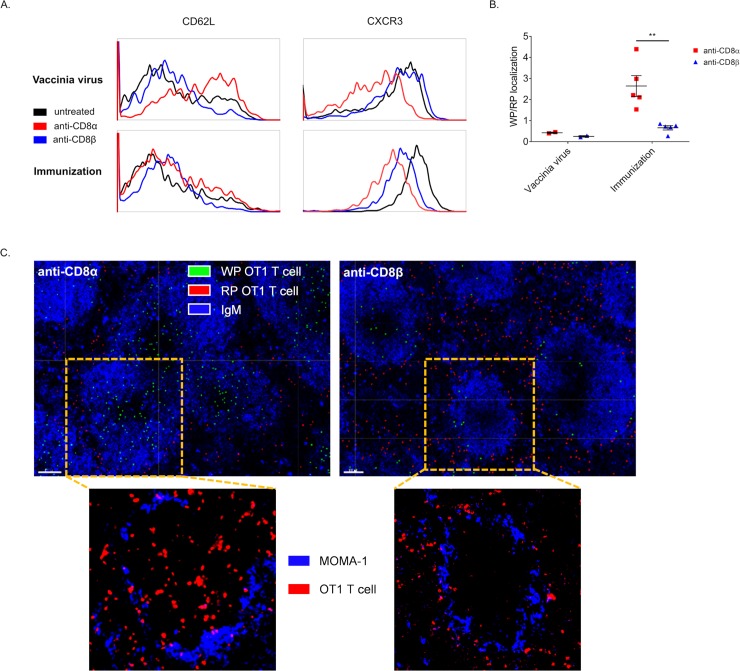
Fig 4. CD8+ T cells surviving depletion differentially localize dependent on mAb used for depletion and type of challenge.
(A-B) 106 CD45.1+ OT1 T cells were transferred i.v. into CD45.2+ mice, treated with anti-CD8α or –β the next day, and immunized or VV-ova infected the day after. Spleens were harvested on day 7 post-infection or immunization and either used for flow cytometry or fixed for immunofluorescence imaging. (A) Post-depletion OT1 T cells were stained for levels of CXCR3 and CD62L. (B) CD45.1+ OT1 T cells were quantified as either white pulp (WP) or red pulp (RP) localized and plotted as a ratio. Points represent the average value per mouse determined from at least 3 sections, pooled from 2 experiments. (C) Representative images of spleen sections 7 days after immunization. Top: blue IgM staining is used to highlight the architecture and delineate RP and WP and false color spots were superimposed to show OT1 T cells scored as WP localized (green) and RP localized (red). White bar represents 100μm. Bottom: images magnified to show individual WP regions; blue MOMA-1 (CD169) staining shows metallophilic marginal macrophages and outlines WP regions and red CD45.1 staining depicts CD45.1+ OT1 T cells.

