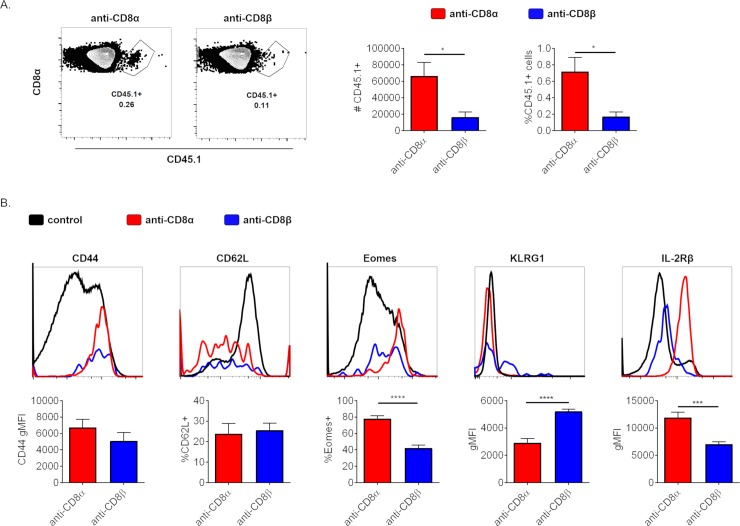
Fig 6. CD8+ T cells that survive anti-CD8α or -β mAb treatment form memory T cells with differing phenotypes.
(A-B) 106 CD45.1 OT1 T cells were transferred i.v. into CD45.2+ mice, treated with anti-CD8α or –β the next day, and immunized the day after. Mice were allowed to rest, unmanipulated for 62–67 days before staining of splenocytes by flow cytometry. (A) Representative flow plots of memory CD45.1+ OT1 T cells surviving treatment with depleting anti-CD8α or -β mAb with quantification in total numbers and as a percent of CD8+ B220- cells. (B) Comparison of select markers associated with memory and differentiation of cells depicted in A. Black control line in histograms depicts CD8+ B220- T cell population as a whole for reference, except for CD44 where black line depicts B220- cells. Data are representative of 2 independent experiments pooled with 6 mice total.

