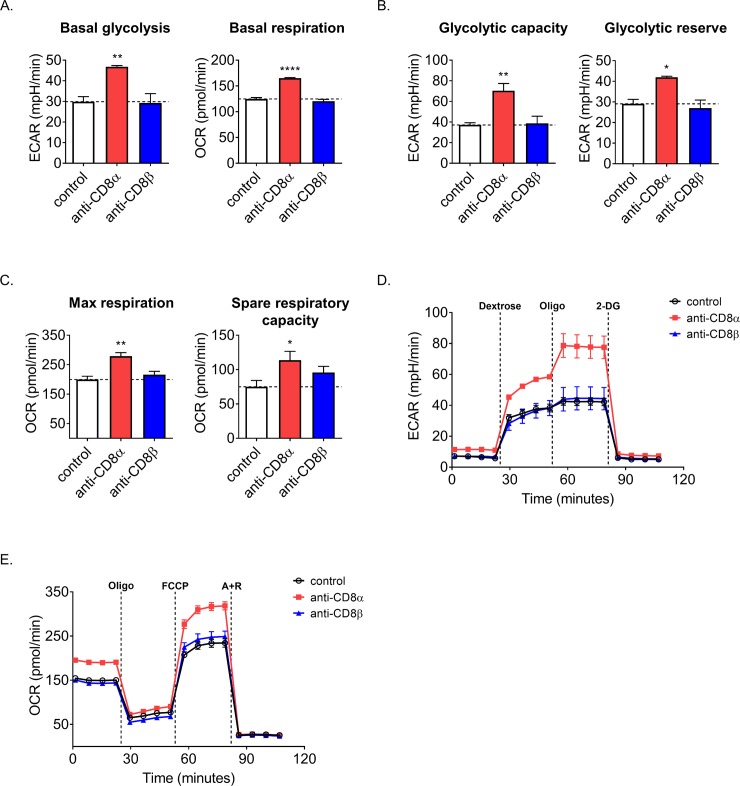
Fig 7. Anti-CD8α boosts the metabolism of CD8+ T cells during activation.
(A-D) CD8+ T cells were isolated from unmanipulated mice and anti-CD3ε /anti-CD28 stimulated for 2–3 days in the presence of either anti-CD8α or –β prior to metabolic flux profiling. Dashed line represents control value. (A) Resting ECAR and OCR of blasting CD8+ T cells. (B) Maximum glycolysis was obtained by injection of oligomycin and glycolytic reserve was then calculated by subtracting basal ECAR from the maximum. (C) Maximum respiration was obtained by injection of FCCP and spare capacity was then calculated by subtracting basal OCR from the maximum. (D) Plot of ECAR and (E) OCR measurements overtime with drug injections indicated. Data are representative of 3 experiments performed with at least 3 technical replicates per treatment group.

