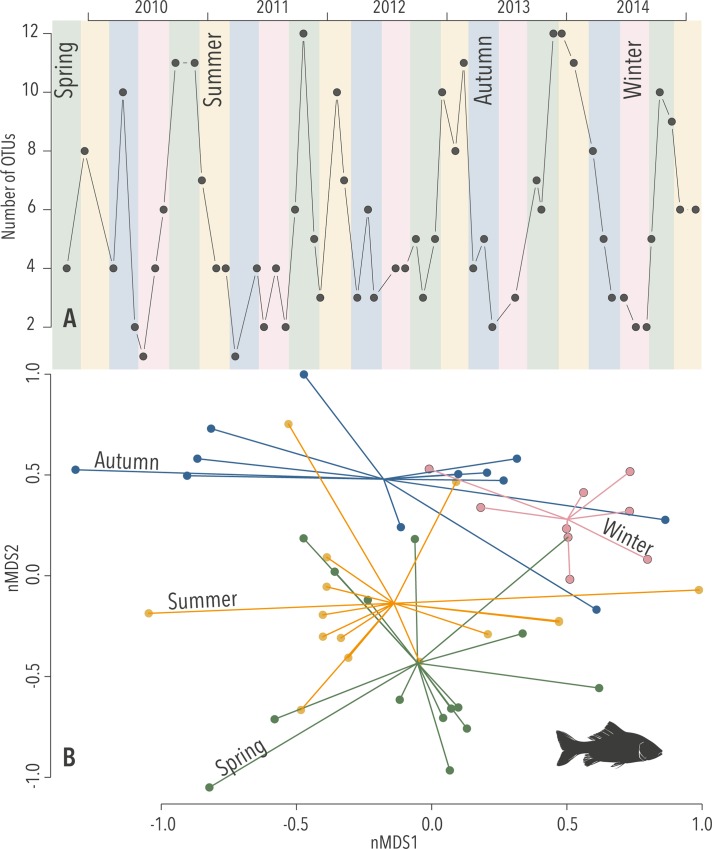
Fig 2.
Seasonality in eDNA revealed by the Fish assay: (A) Number of Operational Taxonomic Units (OTUs) at each time point (Richness; p < 0.001) and (B) Diversity of OTUs as exhibited by a non-parametric multivariate analysis (Assemblage; k = 3, stress = 0.15, p < 0.001), the coloured lines extrude from the centroids of each season towards the variation of Assemblage in each sample.

