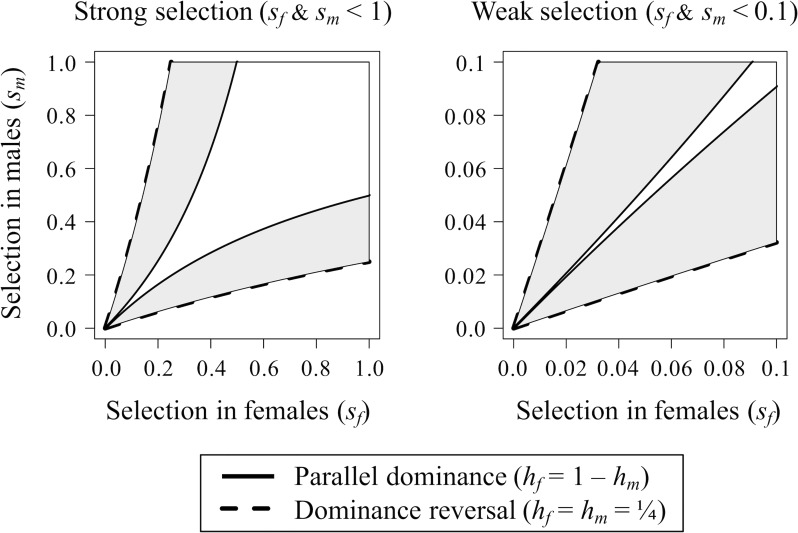
Fig 1. Dominance reversals promote balancing selection at an SA gene.
Left panel: strong selection. Right panel: weak selection. The regions between the solid black curves show the conditions for balancing selection under parallel dominance (hf = 1 − hm). The regions between the dashed lines show the conditions for balancing selection under a partial dominance reversal, where hf = hm = ¼. The grey shaded regions show the expanded parameter space for balancing selection caused by the dominance reversal. This expanded parameter space due to dominance reversal is particularly pronounced when selection is modest to weak (right panel). Stronger dominance reversals (hf and hm < ¼) further expand the conditions for balancing selection. Theoretical curves are based on Eq 1, and the figure is based on Figs 1 and 3 of Kidwell and colleagues [9]. Af, female-beneficial allele; Am, male-beneficial allele; hf, dominance coefficient of the Am allele in females; hm, dominance coefficient of the Af allele in males; SA, sexually antagonistic; sf, the cost to females of being homozygous for the Am allele; sm, the cost to males of being homozygous for the Af allele.

