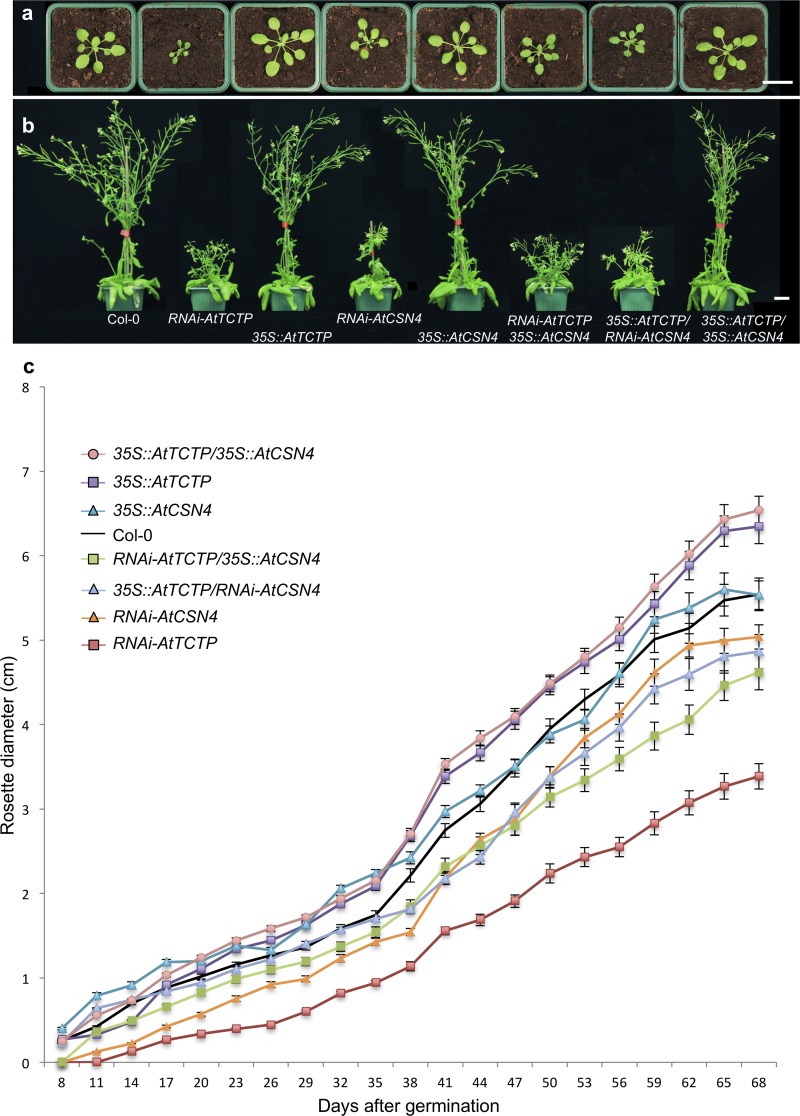
Fig 2. AtTCTP and AtCSN4 control plant development.
(a-b) Plants knockdown for CSN4 (RNAi-AtCSN4) exhibit a delay in development similar to that of RNAi-AtTCTP plants. RNAi-AtCSN4 or RNAi-AtTCTP plants overexpressing AtTCTP or AtCSN4, respectively, show similar phenotype as the simple RNAi lines. Pictures of plants were taken 59 days (a) and 92 days (b) after sowing. Bars: 2 cm. (c) Rosette diameter was measured from 8 days until 68 days after germination. The error bars represent standard errors. n = 18.

