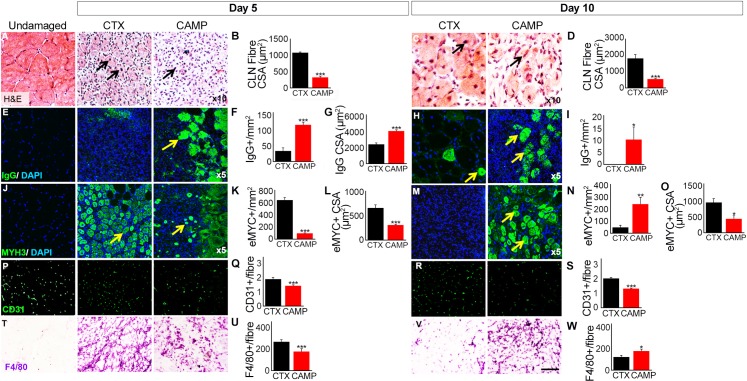
Fig 4. Analysis of tibialis anterior muscle regeneration after administration of CAMP or CTX.
A, H and E staining of muscle identifying centrally located fibre nuclei (CLN) (arrows) and (B) quantification of centrally located muscle fibre size 5 days post administration. C, H and E staining of muscle (arrows) and (D) quantification of centrally located muscle fibre size 10 days post administration. E, intra-fibre IgG localisation for necrotic muscle fibres (arrows) and quantification of necrotic fibre density (F) and size (G) 5 days post administration. H, intra-fibre IgG localisation for necrotic fibres (arrows) and (I) quantification of necrotic fibre density 10 days post administration. J, identification of regenerating muscle fibres through the expression of MYH3 (arrows) and quantification of regenerating muscle fibre density (K) and size (L) 5 days post administration. M, identification of regenerating muscle fibres through the expression of MYH3 (arrows) and quantification of regenerating muscle fibre density (N) and size (O) 10 days post administration. P, Localisation of endothelial marker CD31 and (Q) quantification of capillaries per regenerating muscle fibre 5 days post administration. R, localisation of endothelial marker CD31 and (S) quantification of capillaries per regenerating muscle fibre 10 days post administration. T, immunostaining with antibody F4/80 and (U) its density quantification in damaged region 5 days post administration. V, immunostaining with antibody F4/80 and (W) its density quantification in damaged region 10 days post administration. Data represent mean ± S.D. (n = 5 for each cohort). The p values shown are as calculated by two-tailed Student’s T test for independent variables using GraphPad Prism (*p<0.05, **p<0.01 and ***p<0.001).

