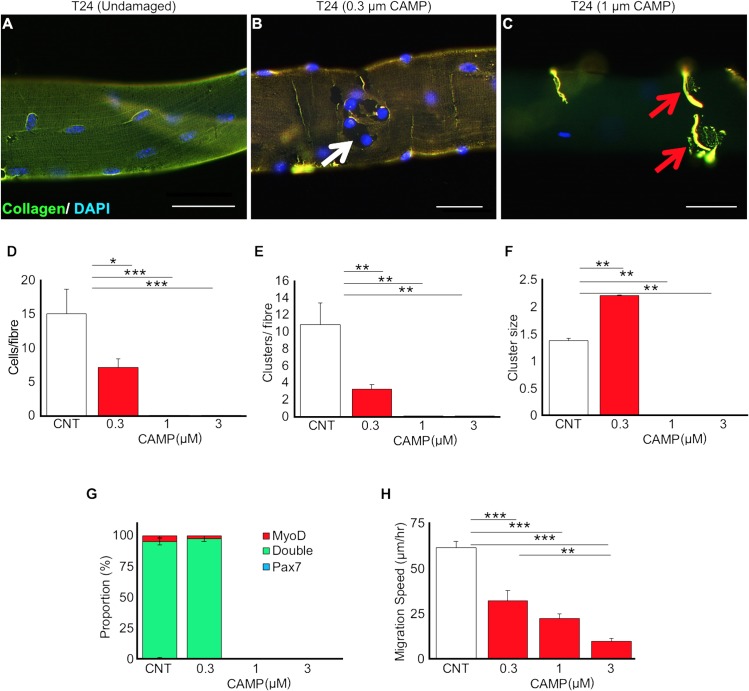
Fig 6. CAMP treatment affects proliferation and migration of satellite cells.
(A-C) Increasing concentrations of CAMP change the distribution of collagen IV. Satellite cell proliferative characteristics following CAMP treatment were analysed. For example, satellite cell number per fibre (D), satellite cell clusters per fibre (E) and cluster size per fibre (F) were quantified. G, myogenic characteristics of satellite cells following CAMP treatment. H, migration rate of satellite cells. Scale bar represents 20μm. Data represent mean ± S.D. (n = 20 fibres for each cohort). The p values shown are as calculated by One-way ANOVA followed by post hoc Tukey's test using GraphPad Prism (*p<0.05, **p<0.01 and ***p<0.001). CNT represents control.

