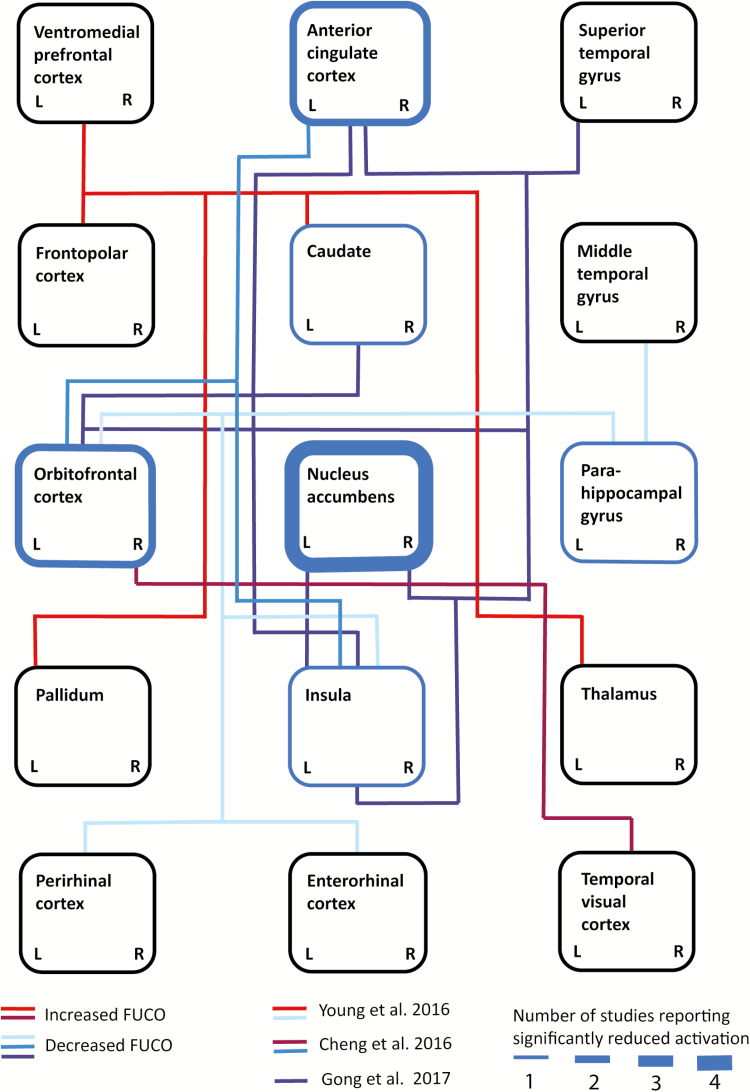
Figure 1.
Schematic depiction of altered functional connectivity and neural activation during reward processing in patients with major depressive disorder (MDD) at baseline. Blue borders of rectangles indicate brain regions with significantly reduced activation during reward processing in depressed patients vs healthy controls (HCs; line thickness indicates the number of replications, as reported by Kumar et al. 2008; Pizzagalli et al. 2009; Redlich et al. 2015; Robinson et al. 2012). Blue-colored connections indicate decreased functional connectivity and red-colored connections indicate increased functional connectivity between areas as measured by functional magnetic resonance imaging (fMRI). Different connectivity studies are distinguishable by different colors. L and R serve to indicate hemispheric differences: changes represented by lines connecting laterally in the cartoon were reported only for the represented side (Cheng et al. 2016: blue and burgundy; Gong 2017: dark red; Young 2016: light blue and vermilion).

