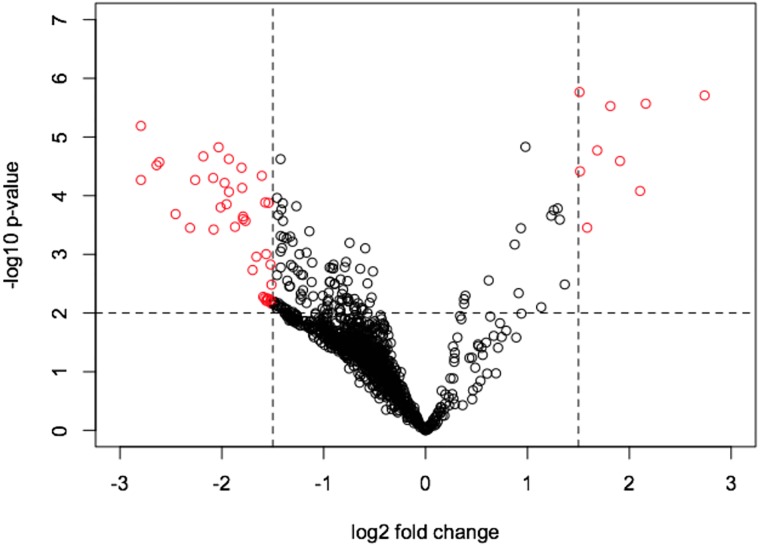
Fig 2. Volcano plot based on fold change (log2) and P value (−log10) of all spectral bins of 1H NMR urinary spectroscopy of heat-stressed (HS) vs. thermoneutral (TN) lactating dairy does.
Red circles indicate the spectral bins that showed significant changes and absolute fold changes greater than 1.5.

