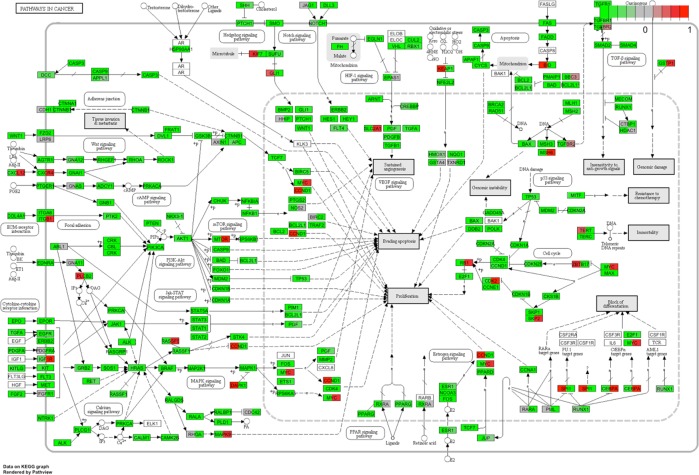
Fig 3. PANOGA identifies the pathways in cancer using the genome-wide DNA methylation dataset.
The genes in the pathway are dual-colored relative to epileptic and healthy groups. Rescaled b values are colored from green to red using the new (-1, 1) range. Epileptic group is represented on the left half and healthy group on the right half of the box representing each gene.

