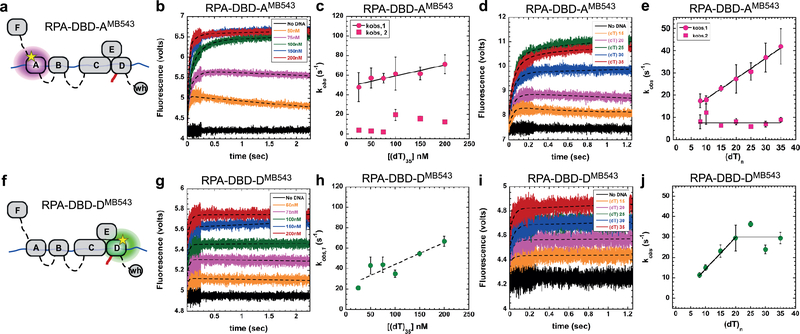
Figure 2. DNA binding dynamics of individual DBDs.
a & f) Cartoons depicting RPA-DBD-AMB543 or RPA-DBD-DMB543 binding to ssDNA and producing a change in fluorescence. Stopped flow experiments done with b & c) increasing concentrations of [(dT)35] ssDNA or d & e) with ssDNA of increasing length, captures the observed rates in fluorescence change for RPA-DBD-AMB543. g – j) Stopped flow analysis of RPA-DBD-DMB543 ssDNA binding dynamics. The data for RPA-DBD-AMB543 are best fit using a two-step model whereas the data for RPA-DBD-DMB543 fit to a one-step process, suggesting distinct DNA context dependent changes in their dynamics. Error bars in panels c, e, h & j represent the mean and s.e. from n=3 independent experiments.

