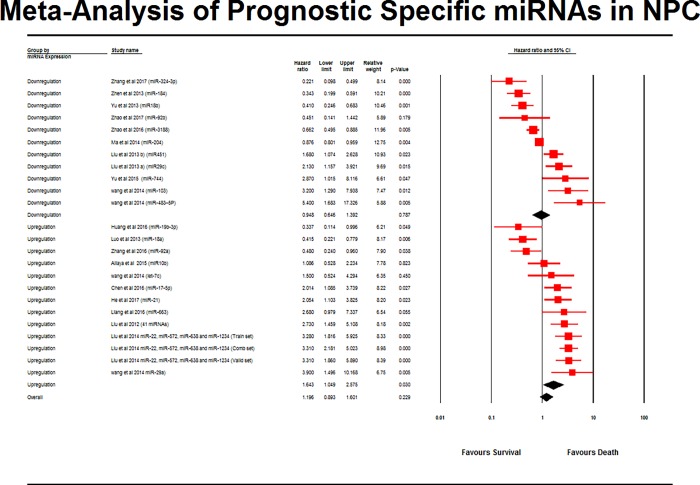
Fig 2. Forest plot for survival outcome of miRNAs in NPC patients.
The pooled hazard ratios of HR values for NPC prognostic data were calculated and analysed using CMA software (version 3.3.070, USA). The red square represents the pooled effect estimate of survival for NPC patients randomly assigned to miRNA evaluation. The black diamond with line indicates the effect size of miRNA of the included studies with 95% confidence interval. The risk ratio of 1 suggests no difference in risk of NPC patients survival. A risk ratio > 1 indicates an increased risk of patients survival whereas a risk ratio < 1 suggests a reduced risk of patients survival. Favours A refers to better survival and B indicates worse survival.

