Figure 5.
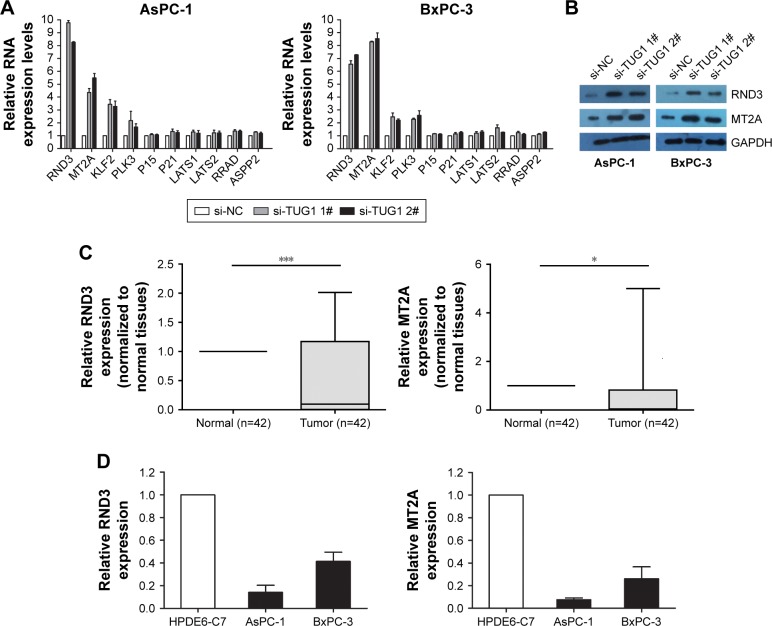
TUG1 regulates the expression of RND3 and MT2A.
Notes: (A) The mRNA levels of RND3, MT2A, KLF2, PLK3, P15, P21, LATS1, LATS2, RRAD, and ASPP2 were determined using qPCR after knockdown of TUG1 in AsPC-1 and BxPC-3 cells. (B) The levels of RND3 and MT2A protein were determined using Western blotting analysis in AsPC-1 and BxPC-3 cells following TUG1 knockdown. (C) Relative expression levels of RND3 and MT2A in PC tissues (n=42) were compared with the corresponding non-tumor tissues (n=42). The expression of RND3 and MT2A was examined using qPCR and normalized to the expression of GAPDH. Lower ΔCt values indicate higher expression. (D) Analysis of the RND3 and MT2A expression levels in two PC cell lines compared with a normal pancreatic cell line (HPDE6-C7) using qRT-PCR. *P<0.05, ***P<0.001.
Abbreviations: PC, pancreatic cancer; TUG1, taurine upregulated 1; qRT, quantitative real-time; qPCR, quantitative PCR.

