Figure 7.
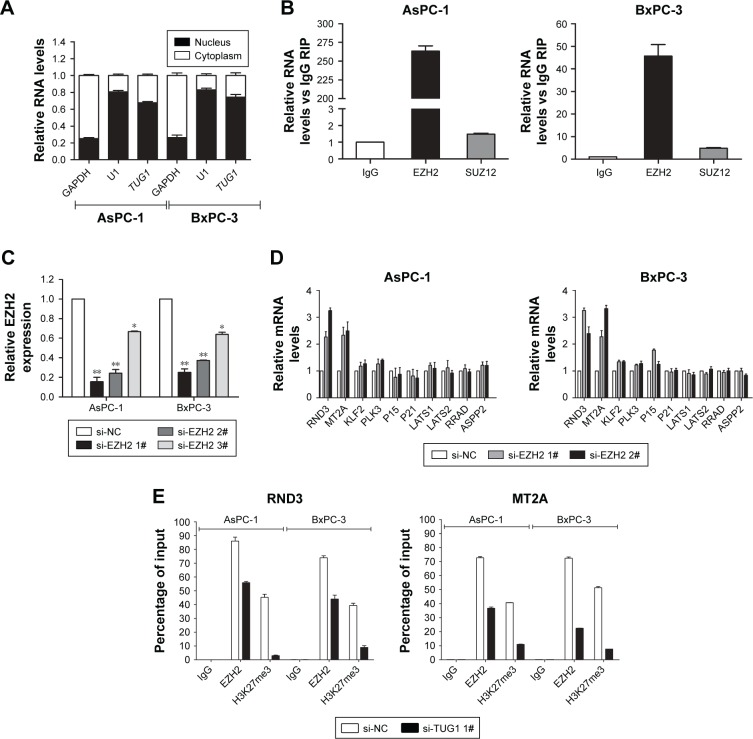
TUG1 interacted with EZH2 to repress the expression of RND3 and MT2A.
Notes: (A) Relative levels of TUG1 in the cell cytoplasm or nucleus of AsPC-1 and BxPC-3 cells were determined using qPCR. GAPDH was used as cytoplasmic control and U1 was used as nuclear control. The distribution of TUG1 RNA in the cytoplasm or nucleus was represented as the percentage rate of total RNA. (B) The RNA levels in immunoprecipitates with EZH2 and SUZ12 were determined using qPCR. The expression levels of TUG1 RNA are represented as fold enrichment relative to the IgG immunoprecipitate. (C) The relative expression levels of EZH2 in AsPC-1 and BxPC-3 cells transfected with si-NC or si-EZH2 (si-EZH2 1#, si-EZH2 2#, and si-EZH2 3#) were measured using qPCR. (D) The mRNA levels of RND3, MT2A, KLF2, PLK3, P15, P21, LATS1, LATS2, RRAD, and ASPP2 were determined using qPCR after knockdown of EZH2 in AsPC-1 and BxPC-3 cells. (E) ChIP shows EZH2/H3K27me3 occupancy on the RND3 or MT2A promoter regions in AsPc-1 and BxPc-3 cells, and knockdown of AGAP2-AS1 decreases their occupancy. The mean values and SD were calculated from triplicates of a representative experiment. *P<0.05, **P<0.01.
Abbreviations: PC, pancreatic cancer; TUG1, taurine upregulated 1; qPCR, quantitative PCR; NC, negative control; EZH2, enhancer of zeste homolog 2; RIP, RNA immunoprecipitation.

