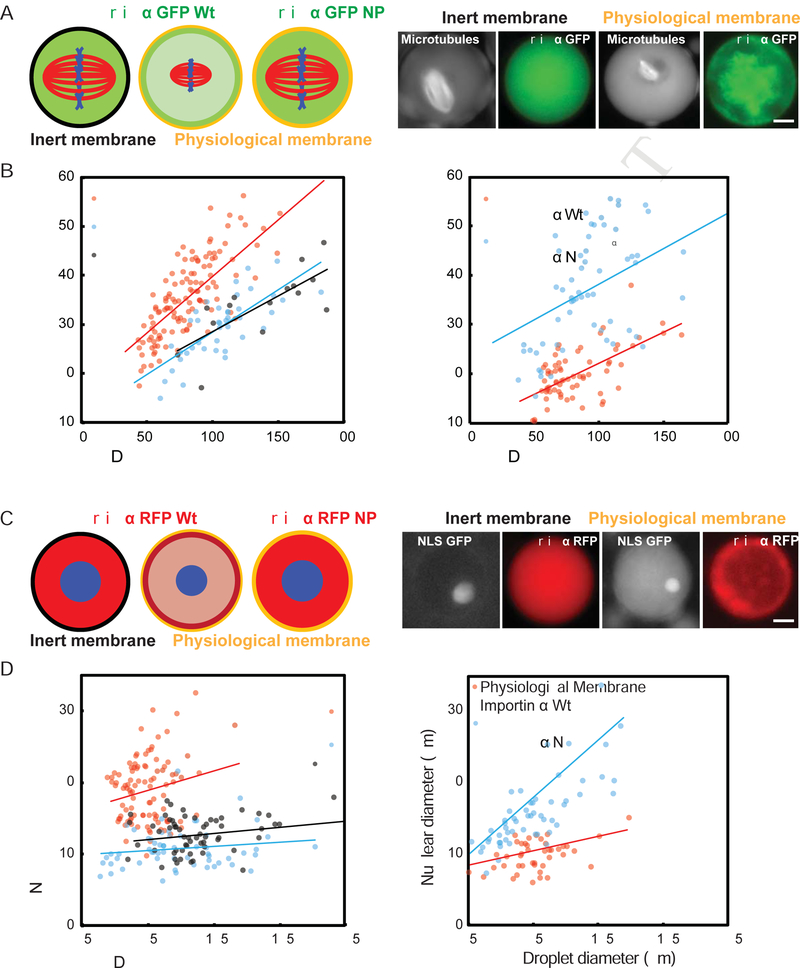
Figure 5. Compartment size, membrane composition, and importin α partitioning modulate spindle and nuclear size.
(A) Left panel: Schematic of spindles assembled in droplets encapsulated within a passivated boundary (inert membrane) or physiological membrane lipids in the presence of 1 μM GFP-tagged wild-type or NP mutant importin α. Right panel: Fluorescence images showing spindles and wild-type importin α localization in droplets of similar sizes formed within either inert or physiological lipid boundaries. The physiological lipid boundary increases the ratio of importin α at the droplet periphery compared to the interior, see Fig. S2E for quantification.
(B) Plots of spindle length at varying cell and droplets diameters. While both types of droplets demonstrated size-dependent spindle scaling, spindles formed in droplets bounded by physiological lipids were smaller, and showed similar scaling properties compared to spindles of corresponding embryo cell sizes in vivo (p < 0.005). Right panel: Addition of the non-palmitoylatable mutant, but not wild-type importin α, reverted the spindle scaling regime to that of the inert boundary (p < 0.05).
(C) Left panel: Schematic of nuclei assembled in droplets encapsulated within a passivated boundary (inert membrane) or physiological membrane lipids in the presence of 1 μM RFP-tagged wild-type or NP mutant importin α. Right panel: Fluorescence images showing nuclei and wild-type importin α localization in droplets of similar sizes formed within either inert or physiological lipid boundaries.
(D) Plots of nuclear diameter at varying cell and droplets diameters. While both types of droplets demonstrated droplet size-dependent nuclear scaling, nuclei formed in droplets bounded by physiological lipids were smaller than those formed in inert boundary droplets, and showed similar scaling properties compared to nuclei of corresponding embryo cell sizes in vivo (p < 0.005). Right panel: Addition of the non-palmitoylatable mutant, but not wild-type importin α, reverted the nuclear scaling regime to that of the inert boundary (p < 0.05). P-values indicate statistical difference between y-intercepts of regression lines from 3 extracts, calculated using an analysis of covariance. Scale bars, 10 μm.

