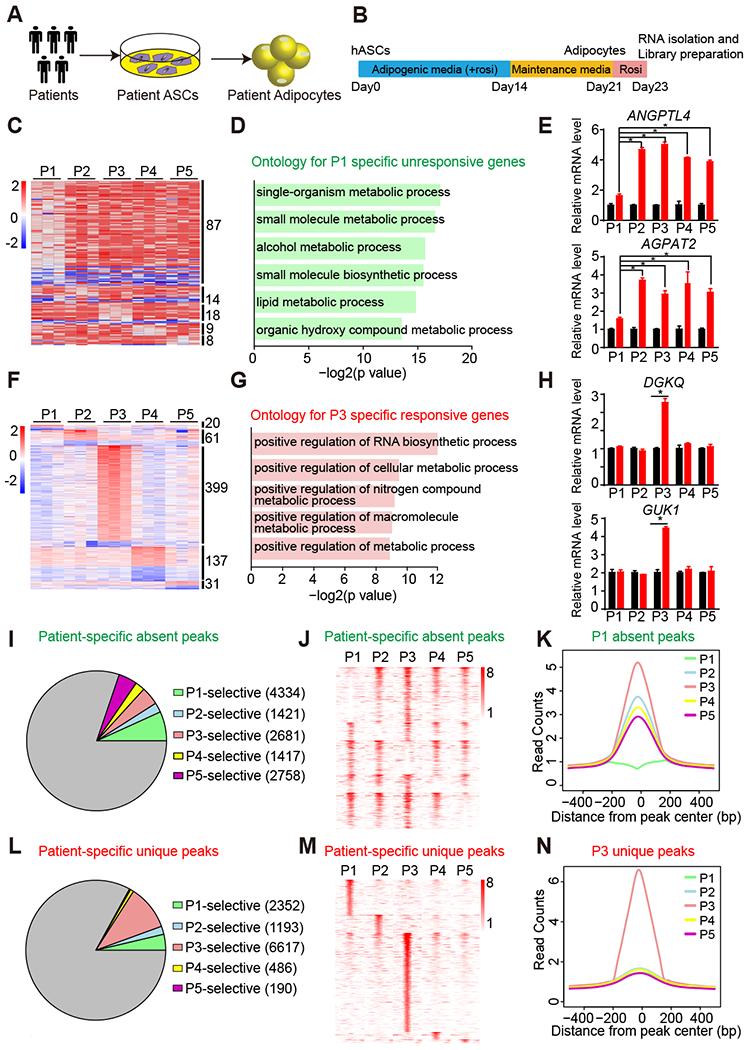
Figure 1. Differential rosi responsiveness and PPARγ genomic occupancy in patient-specific hASC-derived adipocytes.

(A) Experimental design of derivation of patient adipocytes.
(B) Scheme of adipogenic differentiation procedure and rosi treatment.
(C) Heat map of patient-specific unresponsive genes that are not regulated by rosi in only one patient.
(D) Gene ontology for patient P1-specific unresponsive genes.
(E) mRNA expression of patient P1-specific unresponsive genes ANGPTL4 and AGPAT2 in adipocytes from five patients, normalized to HPRT, DMSO was set to 1, as measured by RT-qPCR.
(F) Heat map of patient-specific responsive genes that are significantly regulated by rosi in only one patient.
(G) Gene ontology for patient P3-specific responsive genes.
(H) mRNA expression of patient P3-specific responsive genes DGKQ and GUK1 in adipocytes from five patients, normalized to HPRT, DMSO was set to 1, as measured by RT-qPCR.
(I and J) Proportion (I) and Heat map (J) of patient-specific absent peaks that are specifically absent in only one patient, with at least 2-fold less reads in one patient compared to other four patients.
(K) For P1-specific absent peaks, the average binding profiles are shown in 1 kb windows across patients.
(L and M) Proportion (G) and Heat map (H) of patient-specific unique peaks that are specifically unique in only one patient, with at least 2-fold more reads in one patient compared to other four patients.
(N) For P3-specific unique peaks, the average binding profiles are shown in 1 kb windows across patients.
RT-qPCR data are expressed as mean ± SEM. (*) p < 0.05 in Student’s t-test. n = 3 per group.
