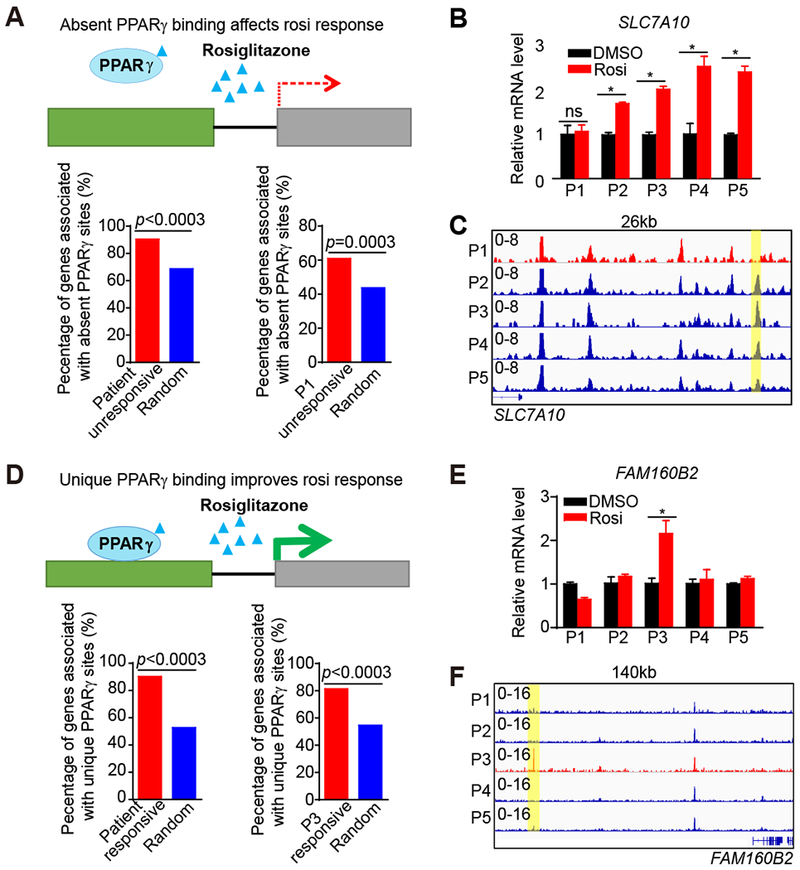
Figure 2. Differential PPARγ binding drives patient-specific rosi response.

(A) Diagram depicting the association between patient-specific absent PPARγ peaks and patient-specific unresponsive genes (upper panel). Percent of patient-specific unresponsive genes surrounded by patient-specific absent peaks within 200 kb (bottom panel). P-values are determined by random test.
(B) mRNA expression of SLC7A10 in adipocytes from five patients, normalized to HPRT, DMSO was set to 1, as measured by RT-qPCR.
(C) Visualization of a Pi-specific absent PPARγ peak region (yellow box) at SLC7A10 loci across patients using Integrative Genomics Viewer (IGV).
(D) Diagram depicting the association between patient-specific unique PPARγ peaks and patient-specific responsive genes (upper panel). Percent of patient-specific responsive genes surrounded by patient-specific unique peaks within 200 kb (bottom panel). P-value is determined by random test as control.
(E) mRNA expression of FAM160B2 in adipocytes from five patients, normalized to HPRT, DMSO was set to 1, as measured by RT-qPCR.
(F) Visualization of a P3-specific PPARγ peak region (yellow box) at FAM160B2 loci across patients.
RT-qPCR data are expressed as mean ± SEM. (*) p < 0.05, (ns) p > 0.05 in Student’s t-test. n = 3 per group.
